Figure 5.
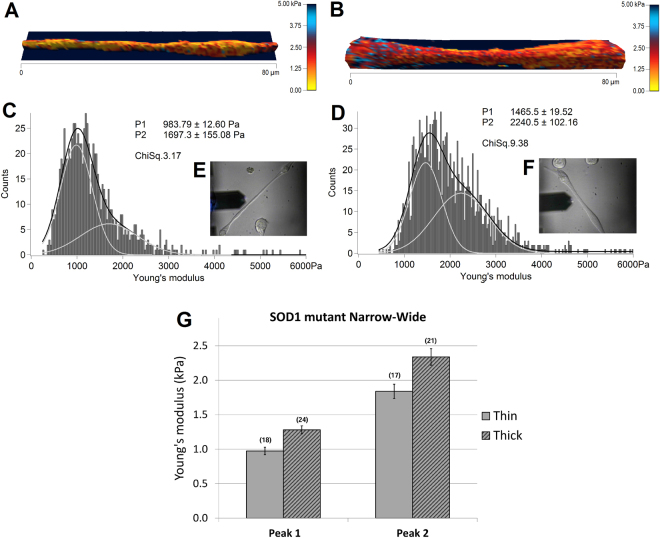
Elasticity of thin (left) and thick (right) SOD1 mutant myotubes. 3D-reconstructions with elasticity coloration of thin (A) and thick (B) SOD1 mutant myotubes are presented. Yellow color indicates softer portions, while red to blue colors show harder regions. Color bar goes from 0 kPa (yellow) to 5 kPa (dark blue). (C and D) represent elasticity distributions of force maps A and B respectively. Light gray curves are single Gaussians, while black curves are the sum of the two. The insets (E and F) show optical images of the measured myotubes. (G) The bars represent the obtained average of the double Gaussians (Peak 1 and Peak 2), fitted on the elasticity value distributions of individual force maps. In brackets the number of the analyzed force maps is indicated. Error bars are standard error of the mean. No significant difference was found between the two populations.

