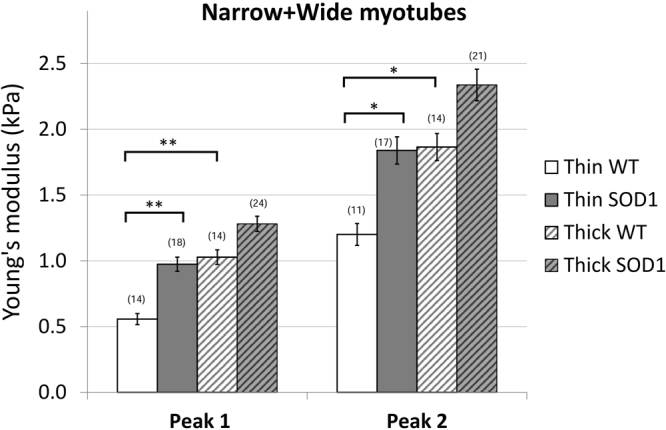
Figure 6.

Average elasticity of the wildtype and SOD1 mutant myotubes. The bars represent the obtained average of the double Gaussians (Peak 1 and Peak 2), fitted on the elasticity value distributions of individual force maps. In brackets the number of the analyzed force maps is indicated. Error bars are standard error of the mean. As indicated, the elasticity of thin wildtype myotubes is significantly lower than thin SOD1 and thick wildtype as well (*p < 0.05, **p < 0.01, Mann-Whitney test).
