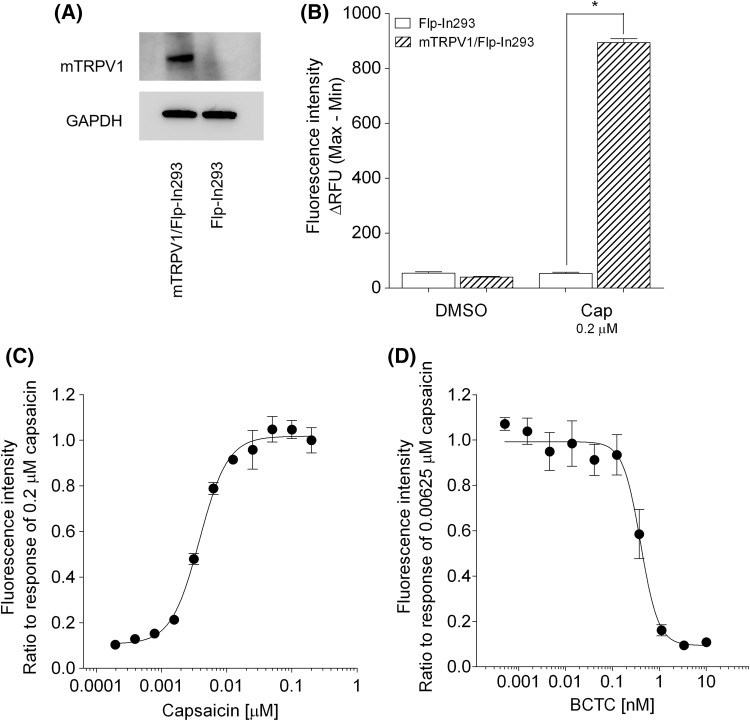
Fig. 1.
Confirmation of functional expression of mTRPV1 in mTRPV1/Flp-In293 cells. a Expression levels of mTRPV1 in mTRPV1/Flp-In293 and Flp-In293 cells were determined by Western blot analysis. b The effect of 0.2 μM capsaicin (Cap) on the uptake of Ca2+ in mTRPV1/Flp-In293 and Flp-In293 cells. c The ratio of fluorescence intensity induced by different concentrations of capsaicin over that induced by 0.2 µM capsaicin. d The ratio of fluorescence intensity induced by 0.00625 µM capsaicin in the presence of 0−10 nM BCTC over that induced in its absence. Each assay was performed in triplicate. The error bar represents the standard error. Statistical significance was determined with Tukey’s test; *p < 0.001 vs Flp-In293 cells

