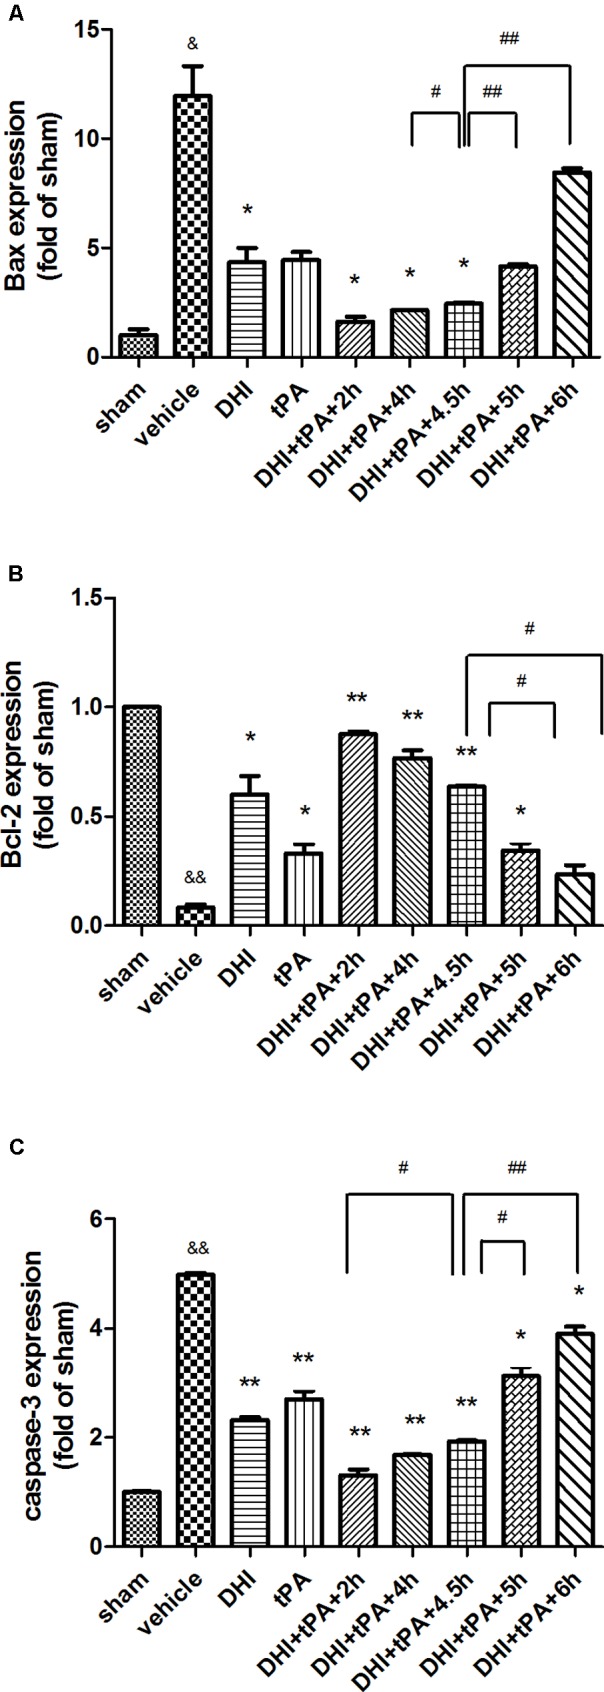
FIGURE 4.

Effect of different treatment time on the mRNA transcriptions of Bax, Bcl-2, caspase-3. (A–C) The real time PCR was performed to determine the relative levels of Bax, Bcl-2, caspase-3 mRNA transcriptions at 24 h after stroke. Data were expressed as mean ± SD, n = 6 per group. ∗P < 0.05, ∗∗P < 0.01 vs. vehicle group. &P < 0.05, &&P < 0.01 vs. sham group. #P < 0.05, ##P < 0.01 vs. DHI+tPA+4.5 h.
