FIGURE 4.

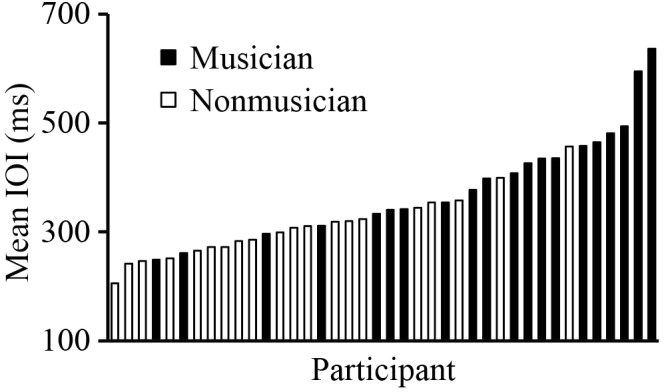
Distribution of SPR values (mean IOI) across participants. Each bar represents the SPR of a single participant; black bars are musicians (group mean = 405 ms) and white bars are non-musicians (group mean = 306 ms).

Distribution of SPR values (mean IOI) across participants. Each bar represents the SPR of a single participant; black bars are musicians (group mean = 405 ms) and white bars are non-musicians (group mean = 306 ms).