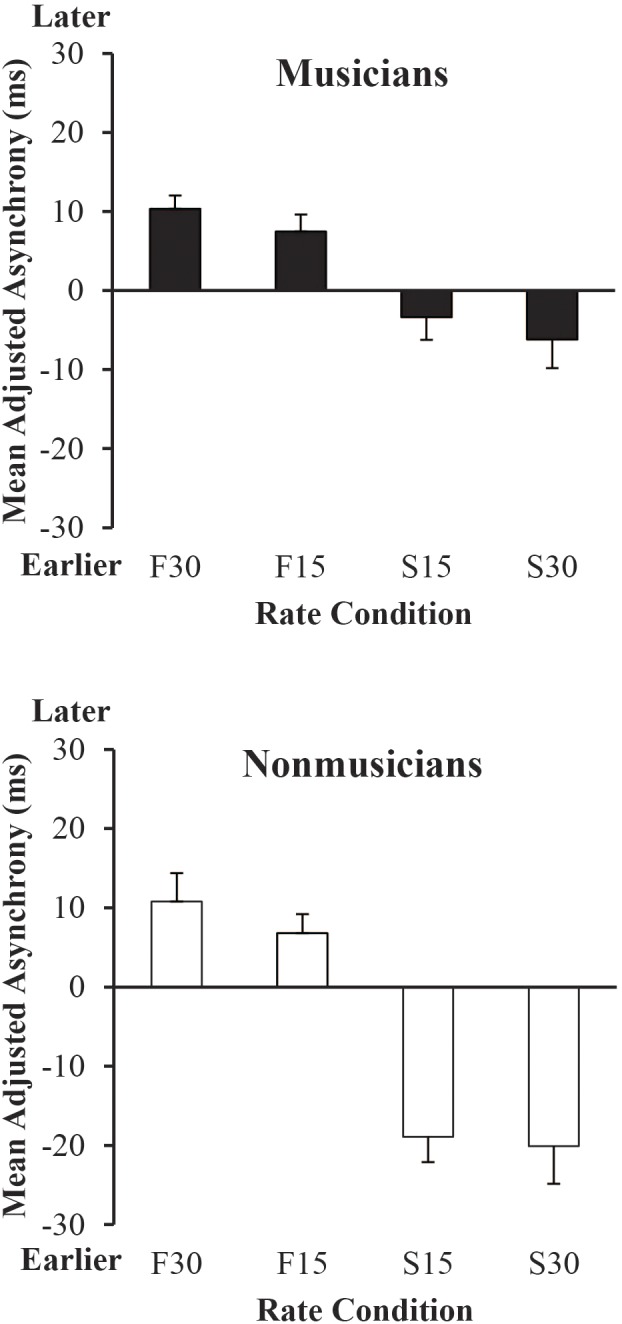
FIGURE 5.

Mean adjusted signed asynchronies (each participant’s rate condition mean asynchrony minus SPR condition mean asynchrony) by rate condition and group. Error bars show standard error. Positive values (earlier) indicate asynchrony values for which the participant tapped sooner and negative values indicate asynchrony values for which the participant tapped later relative to their performance in the SPR condition.
