FIGURE 6.

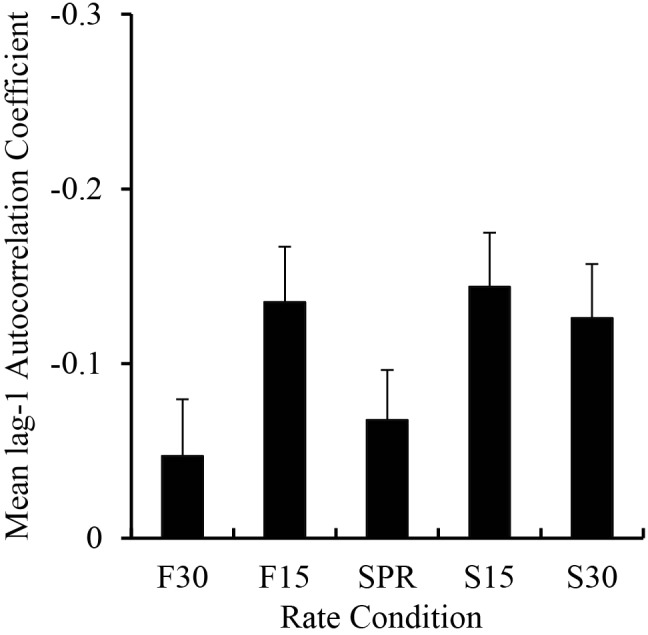
Mean lag-1 autocorrelation coefficients computed on the tapping IOI sequences by rate condition. Negative values are plotted upward. Error bars show standard error.

Mean lag-1 autocorrelation coefficients computed on the tapping IOI sequences by rate condition. Negative values are plotted upward. Error bars show standard error.