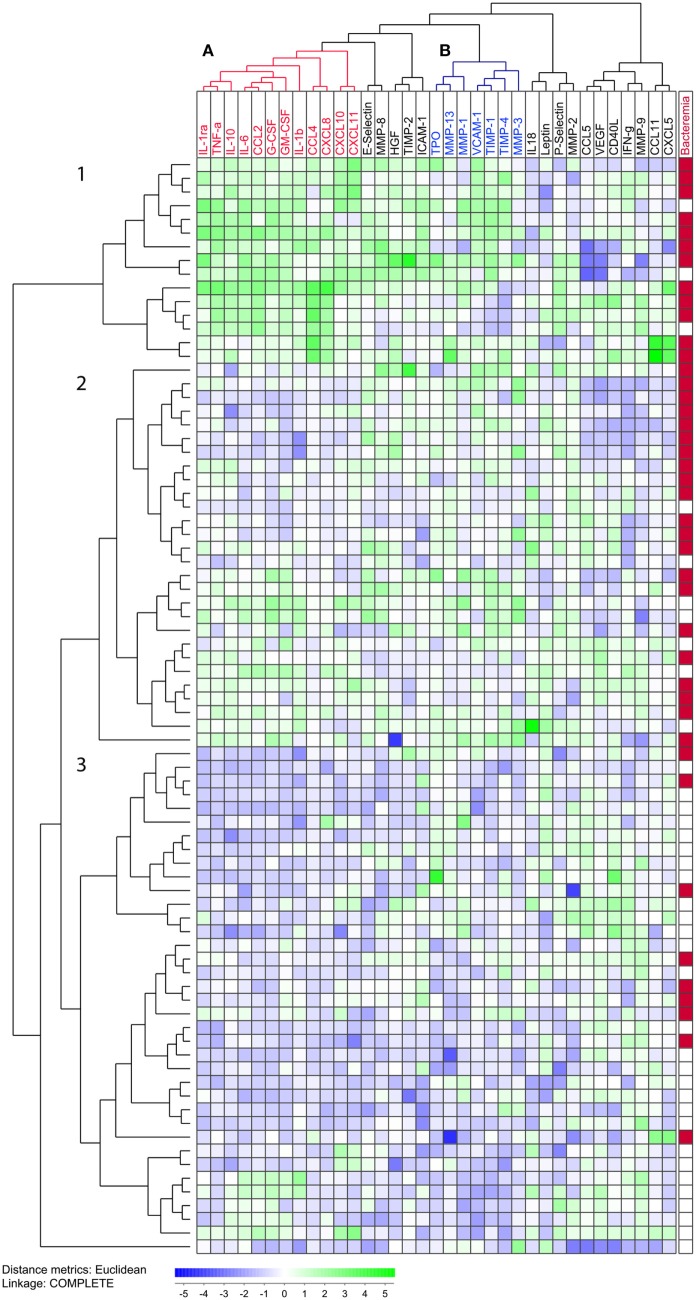
Figure 3.
Unsupervised hierarchical clustering analysis of plasma levels for 35 detectable mediators, and an analysis including all 80 patients. The concentrations were log10 converted and Z-transformed standardized before unsupervised hierarchical clustering. Euclidian correlation test with complete linkage were used for the clustering analysis. The heat-map displays a small square for each mediator for each patient, and each squares colors displays its concentration compared with mean and corrected for SD. The mediators are clustered horizontally and a tree is formed at the top of the figure that display the covariation of different mediators, and to the left a tree is formed where patients with similar mediator covariation cluster together. To the right, we have added clinical information. We see that most mediators cluster close to (i.e., have a similar variation as) biologically related mediators and most of the mediators that differ between the patients are grouped in or between cluster A (red) and B (blue). The patients are clustered vertically and form three main clusters, 1, 2, and 3. The patients with bacteremia are marked in red in the right column. Cluster 3 with the lowest mediator levels included a smaller proportion of patients with bacteremia.

