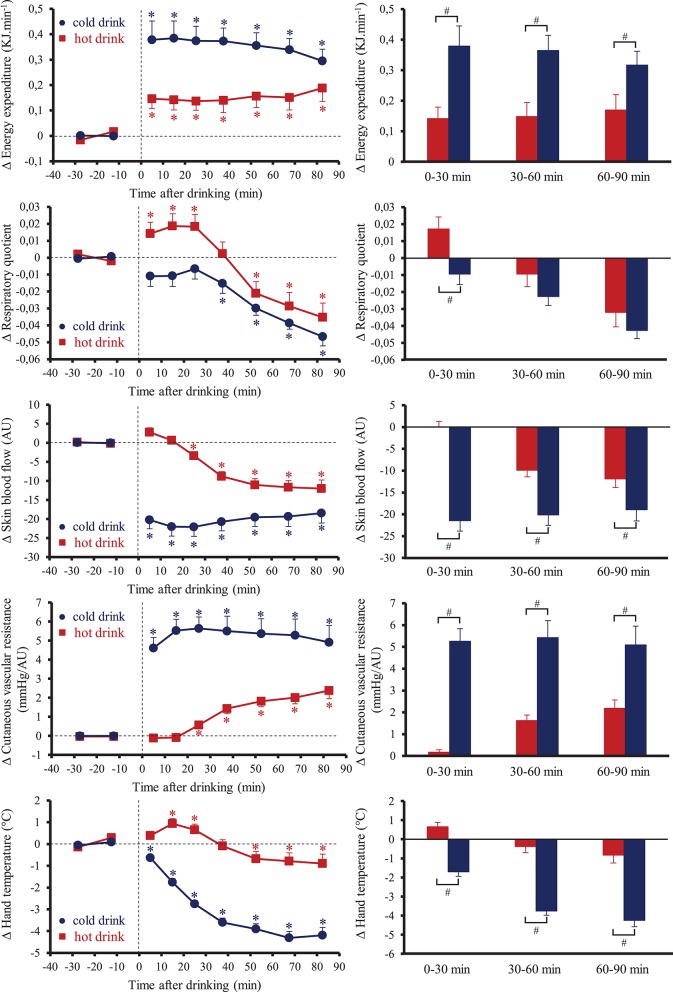
Figure 3.
(Left) Time course of the changes in energy expenditure (EE), respiratory quotient, skin blood flow, cutaneous vascular resistance, and hand temperature. (Right) Mean responses averaged over 0–30, 30–60, and 60–90 min relative to baseline values and presented as a delta (i.e., average over 0–30, 30–60, and 60–90 min post-drink period, respectively, minus the average over the 30-min baseline period). Drinks: hot tea ( and
and  ); cold tea (
 and
and  ). *p < 0.05 significant differences over time from baseline values; #p < 0.05 significant differences between responses to the drinks.

