
FIGURE 4.
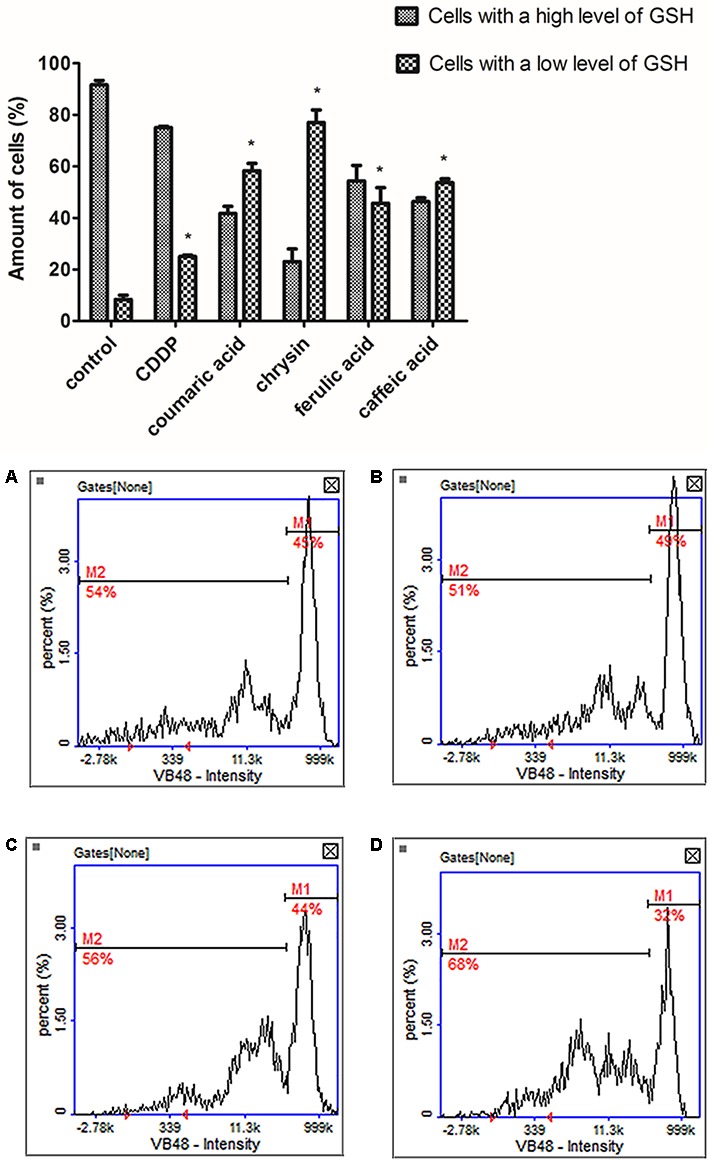
The analysis of cellular reduced glutathione (GSH) levels in CAL-27 cells after 24 h exposure to tested polyphenols in following concentrations: (C) chrysin – 5 μg/mL, (B) caffeic acid – 65 μg/mL, (A) ferulic acid – 50 μg/mL, and (D) p-coumaric acid – 70 μg/mL. Cisplatin (10 μM) was used as a positive control. M1 represents the cells with a high GSH levels (high vitality); M2 represents the cells with low GSH levels (low vitality). The graphs present mean values ± SEM from three experiments done in duplicates. The asterisks determine values significantly different from control samples (∗p < 0.001).