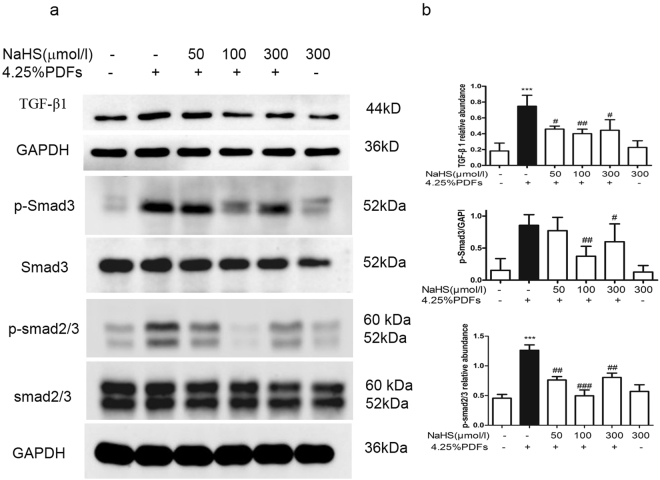
Figure 6.
Effect of H2S on TGF-β1 signal pathway activated by 4.25% glucose PDFs in RPMCs. RPMCs were incubated with or without NaHS (50, 100, 300 μmol/L) for 30 min, followed by the stimulation of the mixture of 4.25% glucose PDFs and culture medium by 1:1 for 1 h. (a) Representative images of TGF-β1, phospho-Smad3, phospho-Smad2/3 are presented and (b) relative abundance of these proteins in each group are calculated. Data represent mean ± SD of three independent experiments. **P < 0.01 versus control group; #P < 0.05, ##P < 0.01 versus 4.25% glucose PDFs group.

