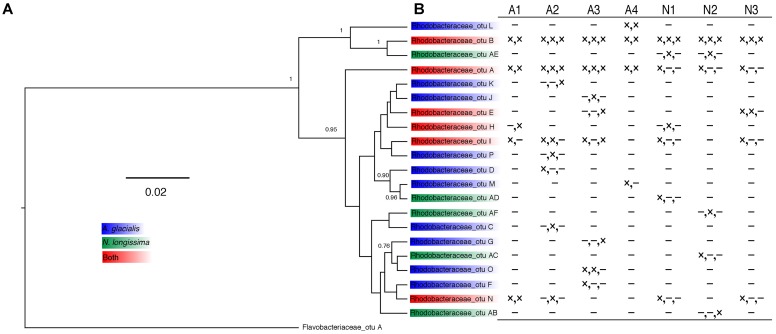
FIGURE 4.
Analysis of Rhodobacteraceae OTUs from A. glacialis and N. longissima. (A) Phylogram showing the relationship between different Rhodobacteraceae OTUs in both diatoms. Posterior probabilities >50 are indicated at the branching points. (B) Table showing the distribution of OTUs across samples. Columns represent different strains of each diatom. Rows represent different OTUs with presence (×) or absence (-) indicated for 20 days, 200 days, and 400 days, respectively.

