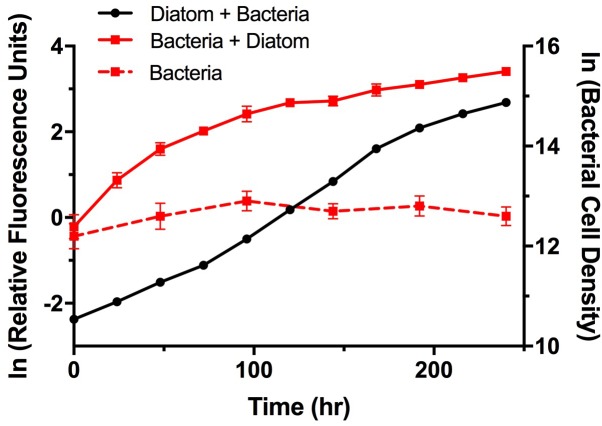
FIGURE 6.
Growth of A3 and its microbiome. Cultures were acclimated as described in the Section “Materials and Methods.” Diatom growth (black circles) with its microbiome was monitored using relative fluorescence and bacterial growth with the diatom (red squares, solid line) or without the diatom (red squares, dashed line) was monitored using microscopy counts of Sybr Green I stained cells. Error bars represent standard deviation (SD) of six cultures.

