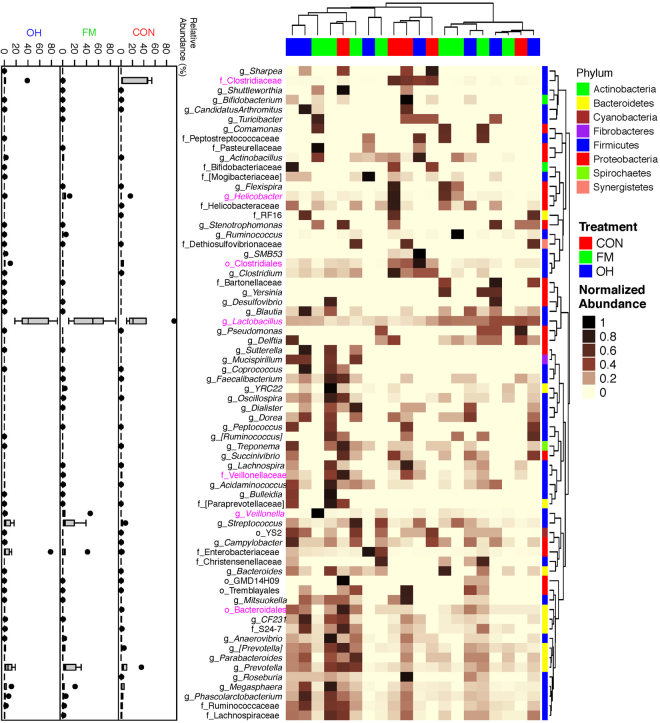
Figure 4.
Cluster analysis of microbial communities in the ileal mucosa of pigs fed control diet (CON), flaxseed meal (FM) and oat hulls (OH) diets. The sample identifiers on the top branches for diet treatments are coloured. Right branches are coloured to indicate the taxonomical assignment of the OTUs at the phylum level. Each row represents one bacterial taxa (relative abundance above 0.01%), and some taxa could only be classified to family (f), order (o), class (c), or phylum (p) level. The taxa names were labeled by the colour code (magenta) to indicate the abundance of the taxa significantly differed between diet treatments (P < 0.05). The normalized relative abundance of bacterial taxa from illumina-sequenced 16 S rRNA sequences in each sample is reflected by the colour of the scale (light yellow to black) on the heat map. The dendrogram on the top shows how the samples are clustered based on the Bray–Curtis dissimilarity measure, averaged by diet treatment. The dendrogram on the right shows clustering of bacterial taxa data based on the Spearman’s rank correlation. The Box-Plots showed the relative abundances of bacterial taxa in ileal mucosa microbiota among the three diet treatments.

