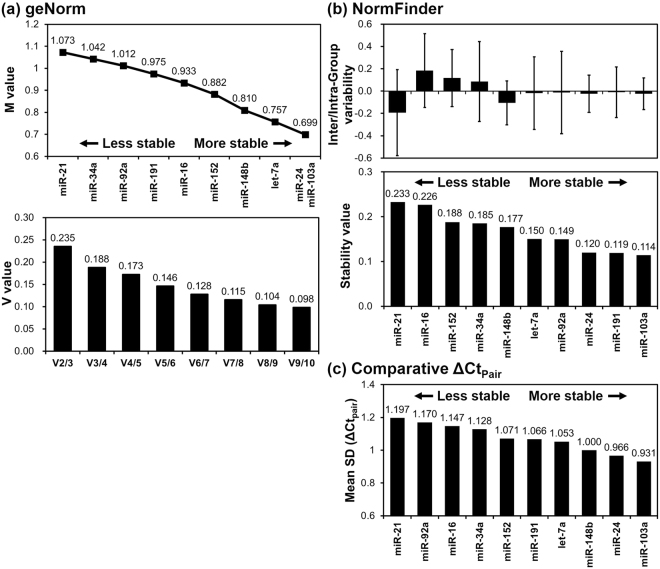
Figure 2.
Stability analysis using geNorm, NormFinder, and the comparative ΔCt method. (a) The average gene expression stability (M value) and the pairwise variation value (V value) calculated by geNorm. (b) The inter- and intra-group variability and stability values estimated using NormFinder. In the variability graph, the error bars represent the average of the intra-group variability and the boxes indicate the confidence interval for the inter-group variability. (c) Mean standard deviation (Mean SD) was calculated by the comparative ΔCt method performing pairwise comparisons between genes (ΔCtPair).

