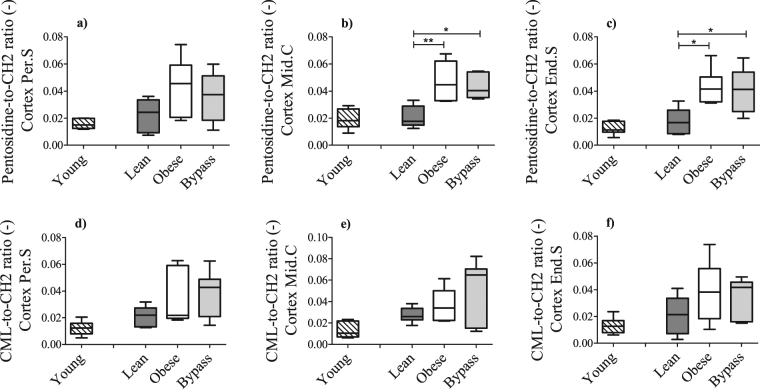
Figure 5.
Relative content of the advanced glycation end products (AGEs) pentosidine and CML in periosteal (a,d), middle (b,e) and endosteal (c,f) cortical locations, respectively, for young, lean, obese and bypass groups. The Raman-specific bands for both AGEs were normalized to the CH2 band, representative of the organic matrix. Per.S: Periosteal area, Mid.C: Mid-cortical area; End.S: Endosteal area. *p < 0.05 and **p < 0.01 when comparing the obese, lean and bypass groups. n = 6/group.

