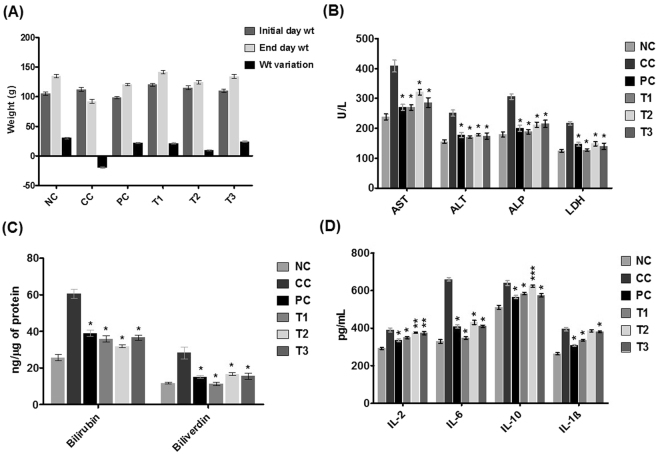
Figure 2.
Effects of IFBOs after oral administration of 10 mg/kg for 15 days in NDEA-exposed rats (A) Body weight, (B) Enzyme levels of AST, ALT, ALP and LDH in serum, (C) Catabolic by-product (bilirubin and biliverdin), and (D) Anti-proliferative biomarkers IL-2, IL-6, IL-10 and IL-1β in liver carcinogenic tissue. Normal control (NC), Carcinogen control (CC: NDEA), Positive control (PC: NDEA + 5-FU), Treatment T1 (NDEA + 6a), Treatment T2 (NDEA + 10a), Treatment T3 (NDEA + 15a). Results are expressed as mean ± SD (n = 8). Statistically significant differences were observed between carcinogen control (CC) group and test groups (PC, T1, T2 and T3). *p < 0.001, **p < 0.01 and ***p < 0.05, when compared to the carcinogen control (CC) group [one way-ANOVA followed by Bonferroni multiple comparison test].

