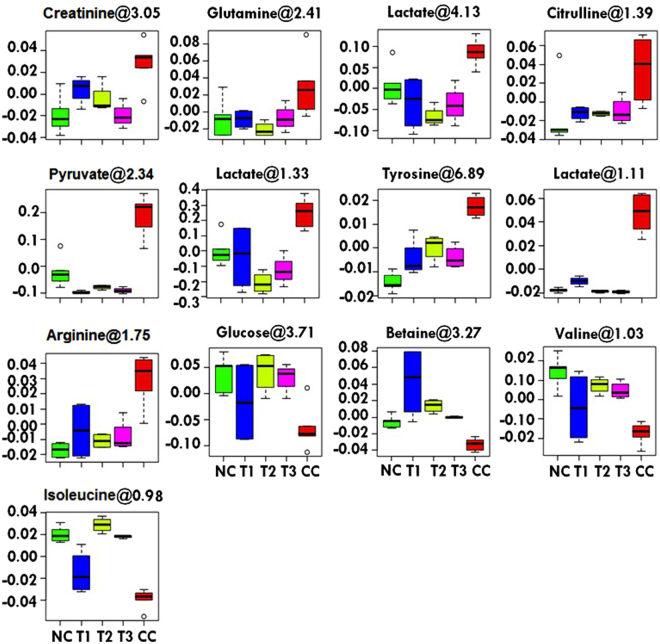
Figure 7.
Metabolic effects of 6a, 10a and 15a treatments: The box-cum-whisker plots are showing relative variations in quantitative profiles of serum metabolites relevant in the context of the pathophysiology of liver cancer. In the box plots, the boxes denote interquartile ranges, horizontal line inside the box denote the median, and bottom and top boundaries of boxes are 25th and 75th percentiles, respectively. Lower and upper whiskers are 5th and 95th percentiles, respectively. NC (Normal control), CC (Carcinogen control: NDEA), T1 (NDEA + 6a), T2 (NDEA + 10a) and T3 (NDEA + 15a).

