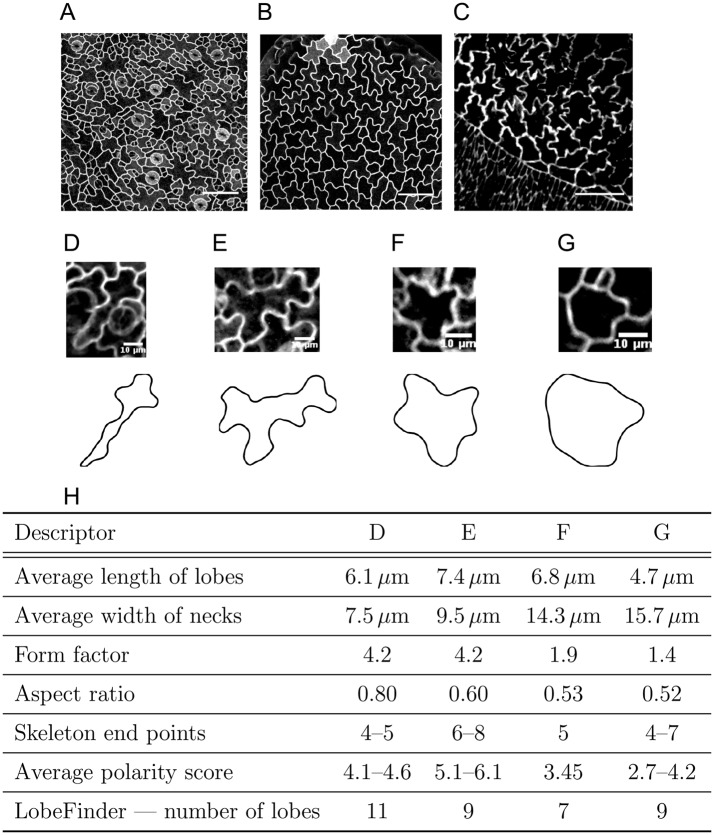
Fig. 1.
Complex cell shapes and the shortcomings of traditional shape quantifiers. (A-C) Complex cell shapes in both plant (A,B) and animal (C) tissues. (A,B) Pavement cells (PCs) of wild-type (A) and speechless mutant (B) Arabidopsis thaliana leaves, characterised by jigsaw-like shapes. (C) Amnioserosa cells in the Drosophila embryo present cell shapes with similar complexity. (D-G) Individual cells from the imaged tissues (upper panels), and the corresponding segmented cell outlines (lower panels). (H) Traditional metrics to quantify cell shape lead to similar values for very different shapes and are image-resolution and parameter sensitive. Here, the cells shown in D-G are compared. See also Fig. S1. Scale bars: 50 μm (A,B); 20 μm (C); 10 μm (D-G).

