Fig. 5.
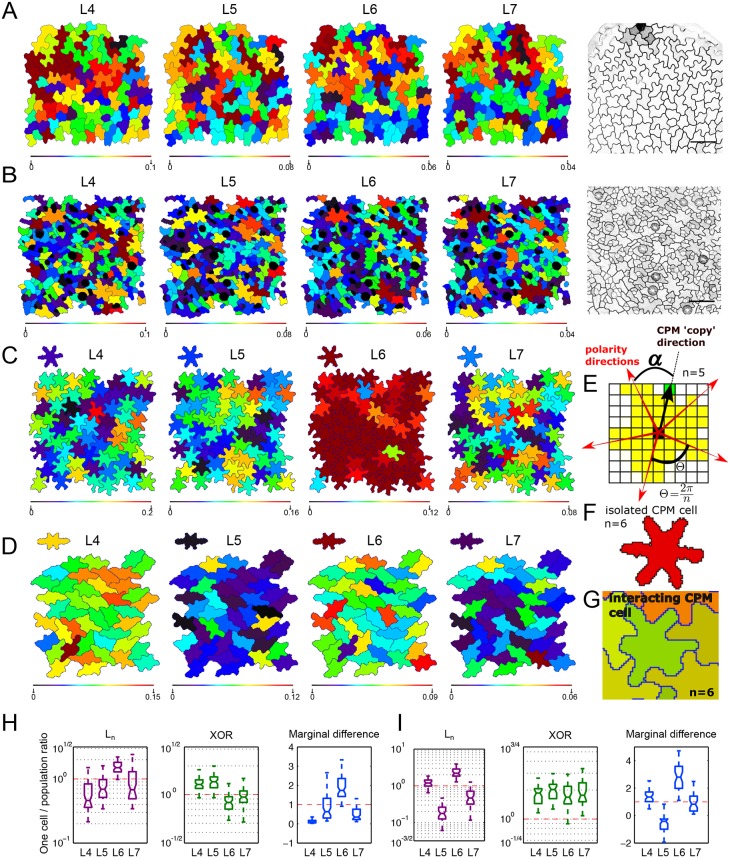
LOCO-EFA analysis on in vivo and in silico pavement cells. (A,B) LOCO-EFA applied to speechless mutant (A) and wild-type (B) leaf tissue. Colour coding depicts the Ln values for four different LOCO-EFA modes, as indicated above each panel, with the scale shown below. Very few cell shapes can be reasonably captured through a single Ln value, revealing cell shape complexity. (C,D) LOCO-EFA applied to in silico PCs reveals the degree of divergence from their specified shape that interacting cells within a tissue experience. Two different specified cell shape populations are shown (SCS1 and SCS3, each with six lobes, see Table S1). The specified shapes are depicted above each panel. Colour coding within the panels and of the specified shapes above each panel again depicts the Ln values, with the scale shown below. Within the tissue, strong deviations in Ln contributions are observed. (E-G) Modelling framework used to generate the in silico tissues. (E) Standard CPM is modified to allow for a specified number of lobes (here, n=5) to form at regular radial spacings (α). (F) This gives rise to a symmetric, multilobed specified cell shape, shown in red. (G) Within the tissue, however, cells with the same specified shape deform while interacting with neighbouring cells. (H,I) Distribution of the ratios, for three different LOCO-EFA metrics, between the cell in isolation and each of the cells within the tissue population, for SCS1 (H) and SCS3 (I), respectively. The central mark of the box plots indicates the median and the edges refer to the 25th and 75th percentiles. n=66 (H) and 44 (I) in silico cells. The red lines highlight where the ratio is unity. Ln and XOR are plotted on a log scale.

