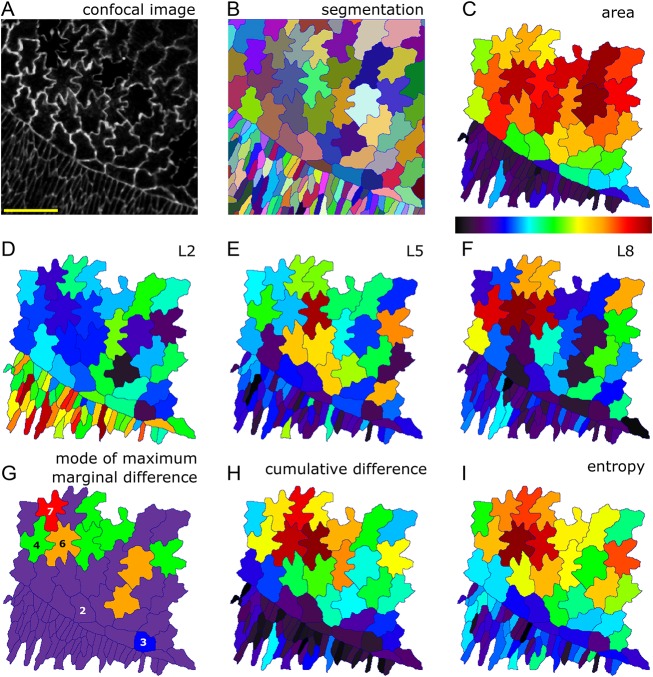
Fig. 6.
Cell shape analysis during dorsal closure of the Drosophila embryo. (A) Confocal image of amnioserosa cells. (B) Segmentation identifies each cellular domain by a unique ID, represented by a distinct colour. (C-I) Several cell shape characteristics, quantified and depicted by the heat map shown below C. (C) Cell area. Amnioserosa cells are larger (red) than surrounding epithelia (blue and purple cells). (D) L2 for each cell. Levels are high in surrounding epithelia, corresponding to predominant cell elongation. (E) L5 for each cell. Amnioserosa cell shapes carry larger representations of higher mode numbers. The cell with the highest L5 contribution does indeed display five distinct protrusions. (F) L8 for each cell. Higher modes substantially contribute to the amnioserosa cells, with L8 strikingly high for the cell with eight visibly prominent protrusions, and high for other multilobed shapes. (G) Mode at which the highest marginal difference occurs, depicted for each cell. Colours represent mode numbers, as indicated. For example, many cells can be described as having a predominantly elongated axis (purple cells, with highest mode 2), whereas one cell is best described as being triangular (blue cell, with highest mode 3), etc. (H) Cumulative difference for each cell, a measure of lobe richness (both number and amplitude). (I) Entropy for each cell, a measure of shape irregularity. Colour scale is between 0 and maximum for D-F and between minimum and maximum for C,H,I.

