Fig. 2.
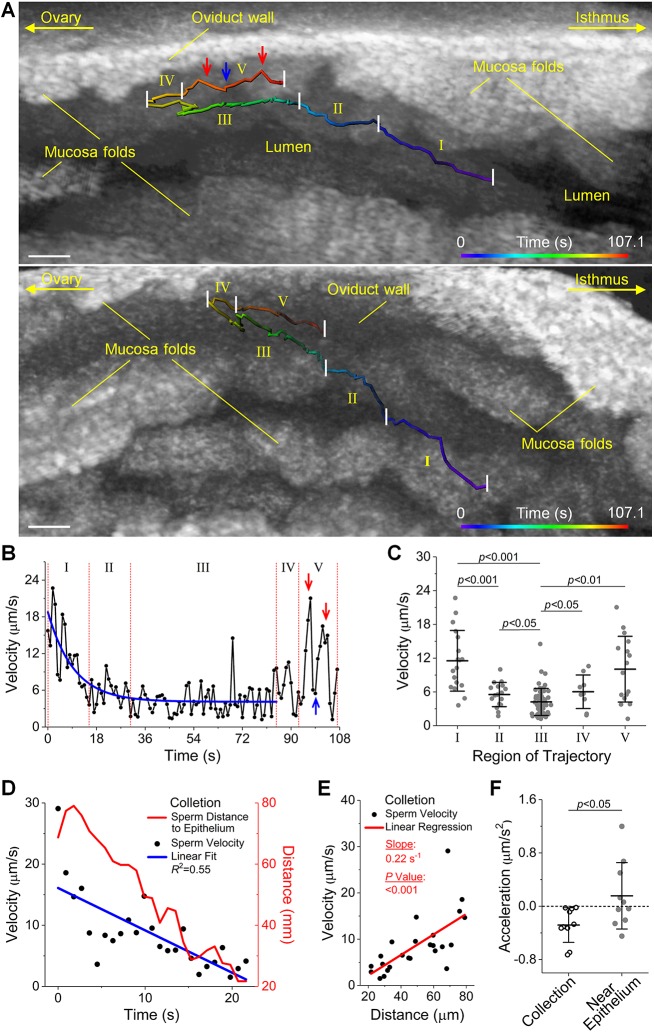
Sperm collection by the epithelium of the ampulla featuring a trend of sperm velocity reduction. (A) A representative sperm trajectory in the ampulla in vivo visualized from two alternative angles shows the process of sperm collection by the luminal epithelium (Movie 1). The sperm swimming in the isthmus-to-ampulla direction through central lumen tend to go toward the ampulla epithelium (parts I, II and III) and then move in the near-epithelium region (parts IV and V). (B) Plot of the sperm velocity over time shows a velocity reduction (fit with an exponential decay function) when the sperm swim toward the ampulla epithelium, and an increase of velocity when the sperm enter the near-epithelium region. Red and blue arrows indicate corresponding positions on the velocity trend and the sperm trajectory in A. (C) Statistical analysis of the velocity between each part of the trajectory shows statistically significant changes of sperm velocity during the sperm collection process. Data are mean±s.d.; P=2.4×10⁻⁴ between parts I and II; P=2.1×10⁻⁵ between parts I and III; P=0.045 between parts II and III; P=0.045 between parts III and IV; P=0.0012 between parts III and V; t-test. (D) An overlay of sperm velocity and sperm distance to the epithelium versus time shows a trend of velocity decrease with the sperm getting closer to the ampulla epithelium in a representative sperm collection process. (E) Linear regression of the sperm velocity with respect to the sperm distance to the epithelium in the representative sperm collection process shows a statistically significant correlation. n=25 for distance-velocity data; P=2.3×10⁻⁴; t statistics for the slope. (F) The sperm collection process features a deceleration in comparison with the near-epithelium movement (in the same overall moving direction with the sperm collection). Data are mean±s.d.; n=10 for sperm in both collection process and near-epithelium movement; P=0.031; Wilcoxon rank sum test; effect size=0.5. Scale bars: 50 µm.

