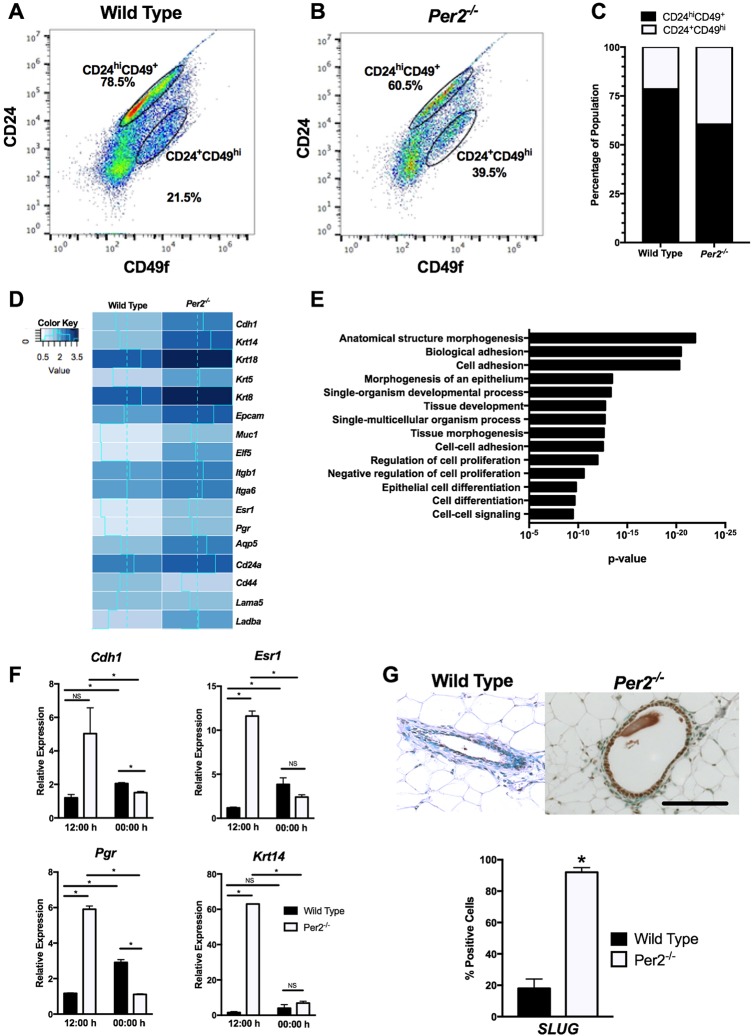
Fig. 5.
Cell lineage and RNA-Seq analysis of WT and Per2−/− MECs. (A-C) Per2−/− MECs showed a 19.55% reduction in luminal progenitors (CD24hi) and 6.63% increase in myoepithelial/basal-like cells (CD49fhi) when compared with WT cells. (D) RNA-Seq results of WT and Per2−/− mice, showing that genes associated with epithelial and basal phenotypes, including Krt14, Krtr5, Krt18 and Krt8, were upregulated in Per2−/− MECs. (E) GOrilla was used to identify biological pathways differentially regulated between the WT and Per2−/− mice. (F) qPCR analysis of luminal and basal markers confirmed that Chd1, Esr1, Pgr and Krt14 levels were higher relative to 18 s in Per2−/− MECs compared with WT MECs at 12:00 h. At 00:00 h, Chd1 and Pgr levels were lower in Per2−/− MECs compared with WT MECs, but no differences in the levels of Esr1 and Krt14 were observed. (G) SLUG staining showed a significant increase in SLUG in Per2−/− mouse mammary tissues compared with WT tissues. *P<0.05; error bars indicate s.e.m. Per2−/−: n=13; WT: n=10. Scale bar: 50 μm.

