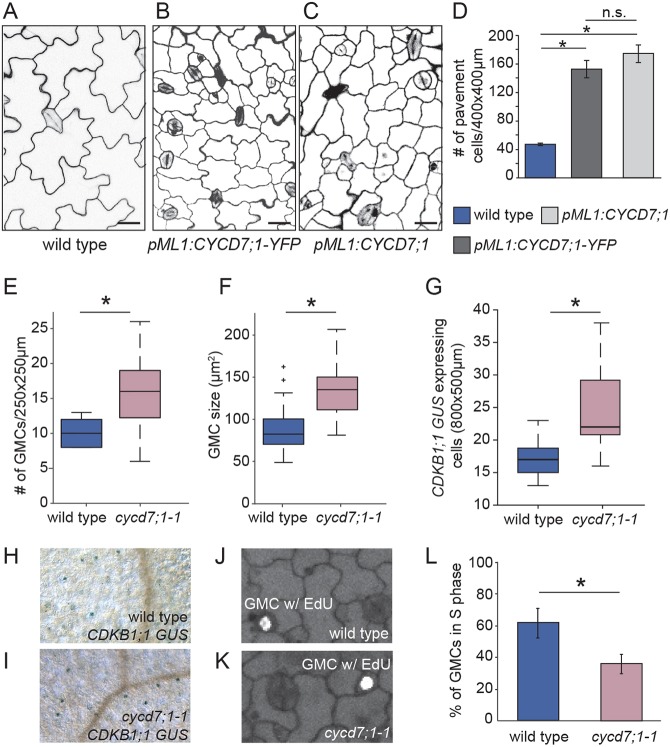
Fig. 2.
CYCD7;1 promotes cell divisions. (A-C) Confocal images of adaxial cotyledon epidermes of wild type, and plants expressing pML1:CYCD7;1-YFP and pML1:CYCD7;1 at 6 dag. Cell outlines were visualized with propidium iodide (magenta). Scale bars: 20 μm. (D) Quantification of extra divisions in pML1:CYCD7;1 and pML1:CYCD7;1-YFP pavement cells compared with those of wild-type cotyledons at 5 dag. Error bars represent standard error; *P<0.005, Student’s t-test; n.s., nonsignificant. (E) Quantification of the number of GMCs in wild-type and cycd7;1-1 cotyledons at 4 dag. *P=0.0032, Mann–Whitney U-test. (F) Quantification of GMC area in wild-type (n=55) and cycd7;1-1 (n=51) cotyledons at 4 dag. *P=6.76×10⁻¹³, Mann–Whitney U-test. (G) Quantification of cells expressing the CDKB1;1-GUS marker in wild-type and cycd7;1-1 cotyledons at 5 dag. *P=0.0023, Mann–Whitney U-test. (H) Image of a wild-type cotyledon expressing CDKB1;1-GUS marker at 5 dag. (I) Image of a cycd7;1-1 cotyledon expressing CDKB1;1-GUS marker at 5 dag. (J) Image of a wild-type GMC with EdU labeling in 4-day-old cotyledons. (K) Image of a cycd7;1-1 GMC with EdU labeling in 4-day-old cotyledons. (L) Quantification of EdU labeling in wild-type and cycd7;1-1 mutants. Graph shows the percentage of GMCs in S phase during a 90-min incubation with EdU. Error bars indicate the 95% confidence interval. *P=7×10⁻⁶, Fisher's exact test. Center lines in box plots show the medians; box limits indicate the 25th and 75th percentiles; whiskers extend 1.5 times the interquartile range from the 25th and 75th percentiles.

