Fig. 3.
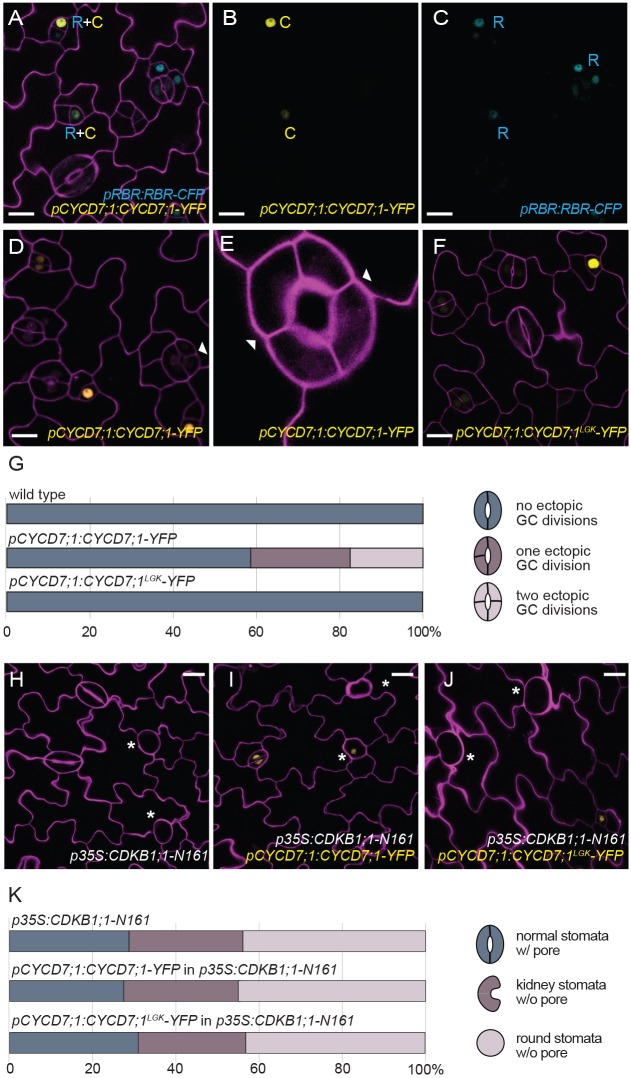
CYCD7;1 requires RBR1 binding and CDKB1;1 activity for ectopic cell divisions. (A-C) Co-expression of pCYCD7;1:CYCD7;1-YFP (yellow, C) and pRBR1:RBR1-CFP (cyan, R) in GMCs at 5 dag. (D,E) Expression of pCYCD7;1:CYCD7;1-YFP drives ectopic cell divisions (white arrowheads). (F) Expression of pCYCD7;1:CYCD7;1LGK-YFP (yellow) does not drive ectopic cell divisions. (G) Quantification of ectopic cell divisions in GCs at 5 dag in cotyledons in wild type (n=173), pCYCD7;1:CYCD7;1-YFP (n=306) and pCYCD7;1:CYCD7;1LGK-YFP (n=288); P=2.7343×10⁻²², Mann–Whitney U-test. (H) Phenotype of dominant-negative p35S:CDKB1;1-N161 at 6 dag. Asterisks label arrested GMCs. (I,J) Failure of pCYCD7;1:CYCD7;1-YFP (I) and pCYCD7;1:CYCD7;1LGK-YFP (J) to suppress CDKB1;1-N161 phenotype at 6 dag. Asterisks label arrested GMCs. (K) Quantification of stomata phenotypes in cotyledons in p35S:CDKB1;1-N161 (n=238), pCYCD7;1:CYCD7;1-YFP in p35S:CDKB1;1-N161 (n=296) and pCYCD7;1:CYCD7;1LGK-YFP in p35S:CDKB1;1-N161 (n=217) at 6 dag. Confocal images show cell outlines (magenta) stained with propidium iodide. Scale bars: 10 μm (A-D,F) and 20 μm (H-J).

