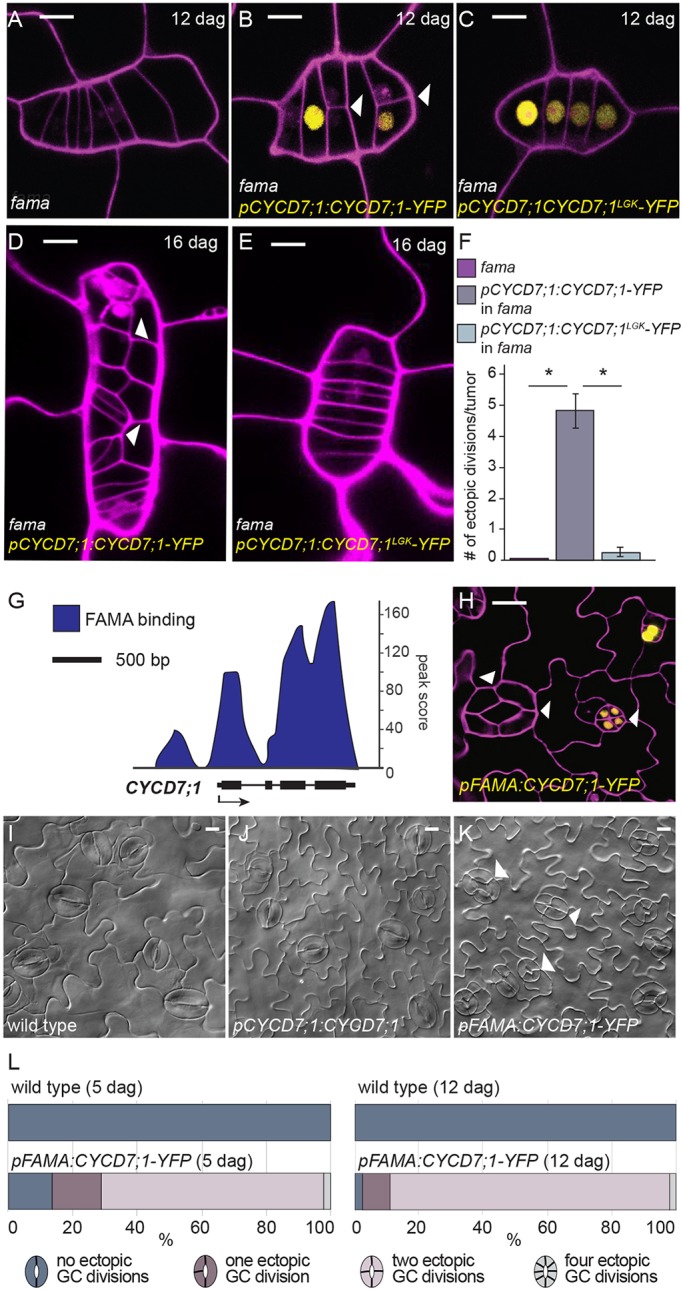
Fig. 5.

CYCD7;1 expression is regulated by FAMA, which serves to constrain CYCD7;1 activity. (A-E) Confocal images of fama at 12 dag, and pCYCD7;1:CYCD7;1-YFP in fama mutant background and pCYCD7;1:CYCD7;1LGK-YFP in fama mutant background at 12 dag and 16 dag. (F) Quantification of ectopic divisions in tumors of fama mutants, pCYCD7;1:CYCD7;1-YFP in fama mutant background and pCYCD7;1:CYCD7;1LGK-YFP in fama mutant background. *P<0.0001, Student's t-test. (G) ChIP-seq profile of FAMA binding to the promoter and gene body of CYCD7;1. Black arrow indicates gene orientation and transcriptional start sites. (H) Confocal image of pFAMA:CYCD7;1-YFP at 5 dag. White arrowheads show ectopic division and prolonged CYCD7;1-YFP presence. (I-K) DIC images of abaxial cotyledon epidermis of wild type, pCYCD7;1:CYCD7;1 and pFAMA:CYCD7;1-YFP at 12 dag. White arrowheads point at ectopic cell divisions. (L) Quantification of ectopic cell divisions in wild type (n=142) and pFAMA:CYCD7;1-YFP (n=237) at 5 dag (P=1.4371×10–54, Mann–Whitney U-test), and in wild type (n=125) and pFAMA:CYCD7;1-YFP (n=153) at 12 dag (P=1.3625×10–55, Mann–Whitney U-test). Differences between pFAMA:CYCD7;1-YFP at 5 dag and 12 dag are significant (P=6.4773×10–05, Mann–Whitney U-test). Differences between pFAMA:CYCD7;1-YFP at 5 dag and pCYCD7;1:CYCD7;1-YFP at 5 dag are also significant (Fig. 3G; P=1.0473×10–37, Mann–Whitney U-test). Confocal images show cell outlines (magenta) stained with propidium iodide. Scale bars: 10 µm.
