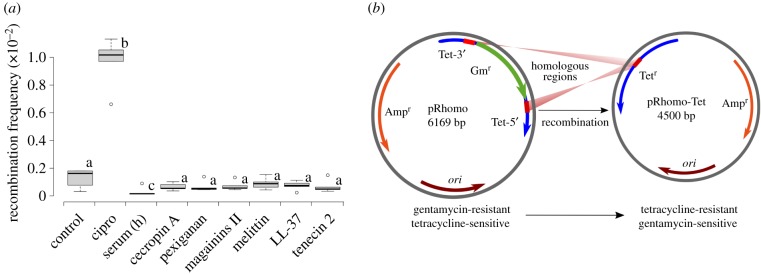
Figure 1.
(a) Graphical representation of recombinant frequencies of E. coli MG1655 treated with different AMPs. Ciprofloxacin was used as a positive control. Boxplots represent the median values of recombination frequency of the bacteria exposed to the half-MIC during 4 h. Only ciprofloxacin b had a significantly higher recombination frequency (p = 0.006, Mann–Whitney test). The human serum c showed a significant lower recombination rate (p = 0.018, Mann–Whitney test) than the control group. The same letter represents no statistical differences while different ones indicate significant difference with the control (basal recombination rate value of the non-treated bacteria). Section (b) is a representation of the plasmid system to measure the recombination frequency (modified from reference [11]), explained in details in Material and methods.

