
Figure 1.
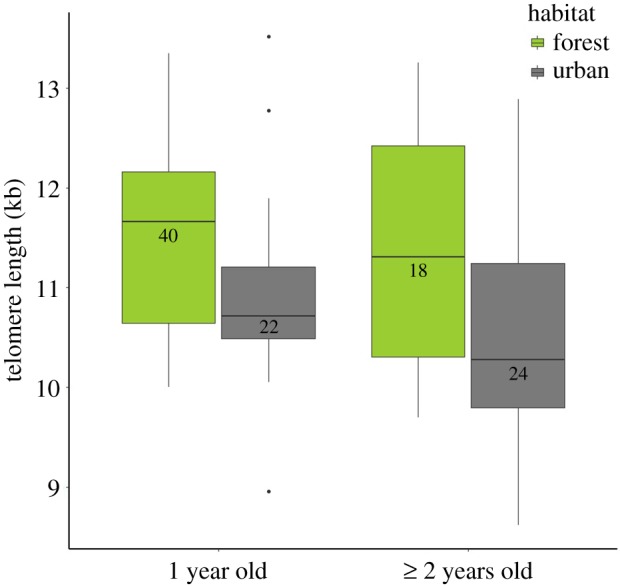
Telomere length of blackbirds for each habitat in all study locations combined. Box plots show the median, upper and lower quartiles, maximum and minimum values, and outliers. (Online version in colour.)
Official websites use .gov
A
.gov website belongs to an official
government organization in the United States.
Secure .gov websites use HTTPS
A lock (
) or https:// means you've safely
connected to the .gov website. Share sensitive
information only on official, secure websites.
Telomere length of blackbirds for each habitat in all study locations combined. Box plots show the median, upper and lower quartiles, maximum and minimum values, and outliers. (Online version in colour.)