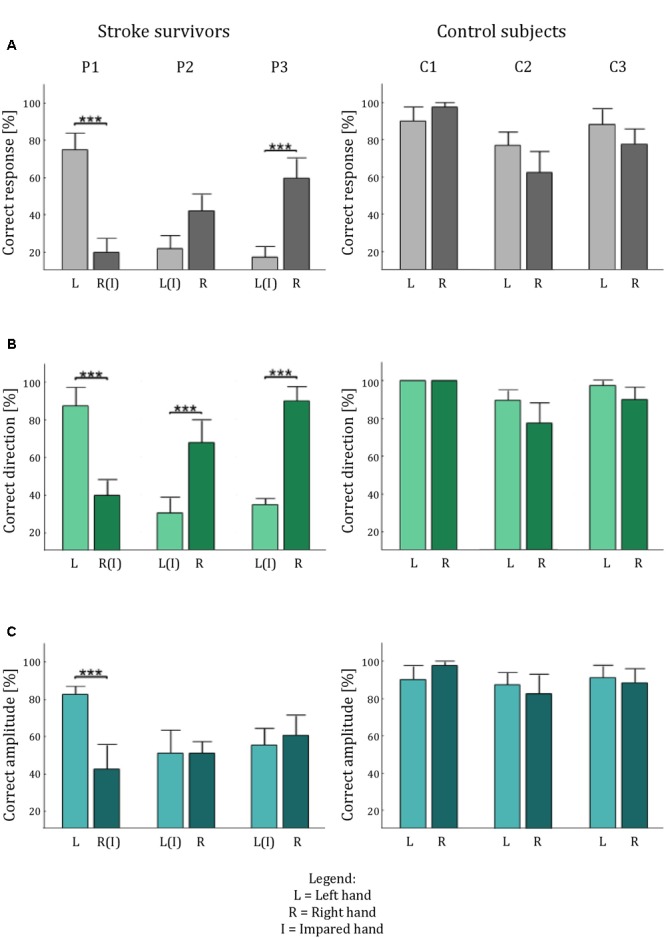
FIGURE 7.

Tactile acuity in both hands of the stroke survivors and the control participants. The histograms show the average percentage performance in term of: correct answer (A), correct direction (B), and correct amplitude (C) for each hand for each subject. Error bars indicate the standard error of the mean. ∗∗∗p < 0.001.
