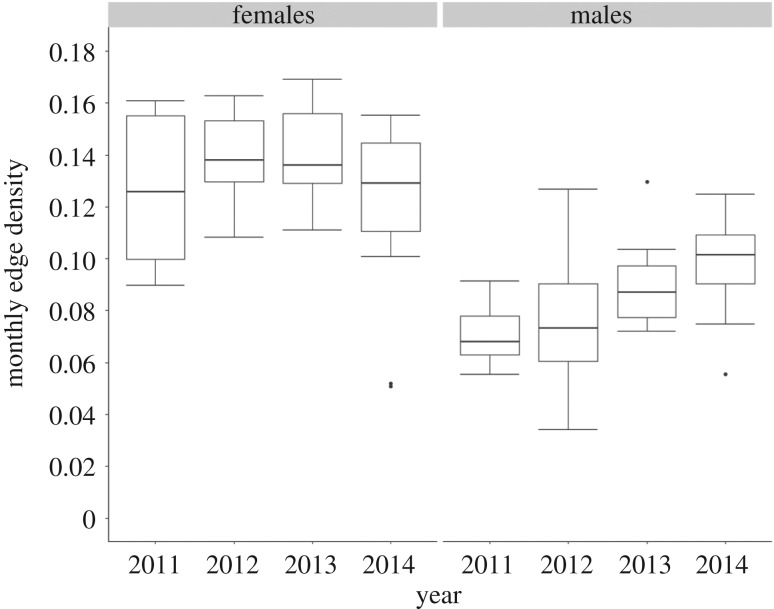
Figure 2.
The monthly edge densities of movement networks for female and male grey reef sharks (Carcharhinus amblyrhynchos) over each year of the study period; these differed significantly between the sexes (p < 0.01); the boxplots present the median and quartile values, the circles denote outliers.

