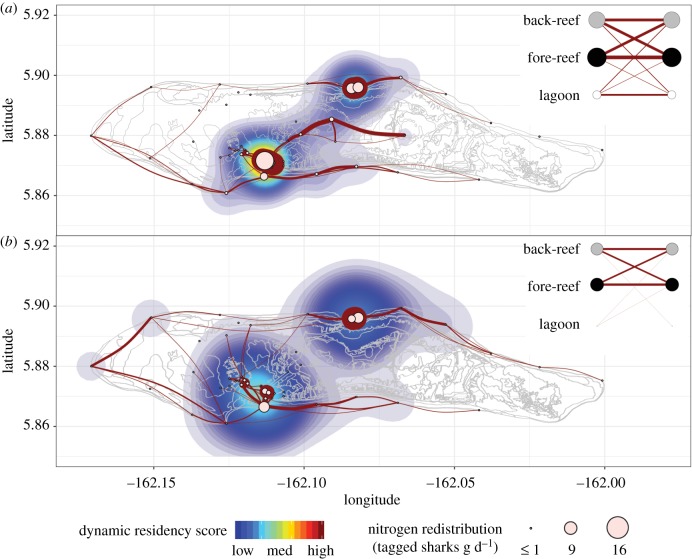
Figure 3.
The 4-year movement networks of (a) female (n = 28) and (b) male (n = 13) grey reef sharks overlaid on kernel densities that represent dynamic residency at each receiver. Networks include only movements that took ≤110 h and have been filtered to show the 75 most frequently used routes by each sex. Edge thickness represents the frequency of movements (male range = 36–2711; female range = 129–13 131). The dynamic residency score was calculated as the node strength (Si) of each receiver divided by 100 and multiplied by a standard residency index, R (male range = 1–1401; female range = 2–10 474). The size of each node represents the potential N redistribution by the tagged grey reef sharks (table 2). The inset habitat networks illustrate the relative frequency of shark movements within and between geographical zones, with the size of the nodes representing the relative detection frequencies in each habitat; the left-hand nodes represent the zone the sharks moved into after last being detected in the habitat depicted by the right-hand node. The base map of Palmyra Atoll was acquired from NOAA National Ocean Service, National Centers for Coastal Ocean Science [38]. (Online version in colour.)

