
Figure 2.
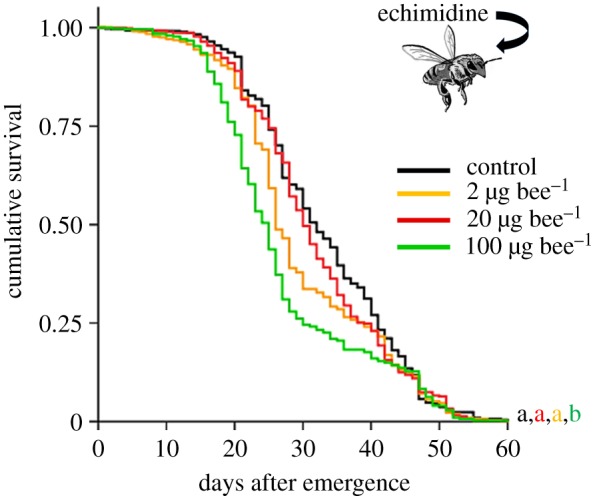
Toxicity of echimidine for adult bees. Survival curves represent the control group (n = 459), bees fed with echimidine at 2 µg bee−1 (n = 451), 20 µg bee−1 (n = 455) and 100 µg bee−1 (n = 448). The results for each concentration are reported as the median values of three experiments. For each experiment, test and control series were performed in triplicate. Letters at the end of the curves designate significant differences between the treatment groups (pairwise comparisons of means, p < 0.02).