
Figure 3.
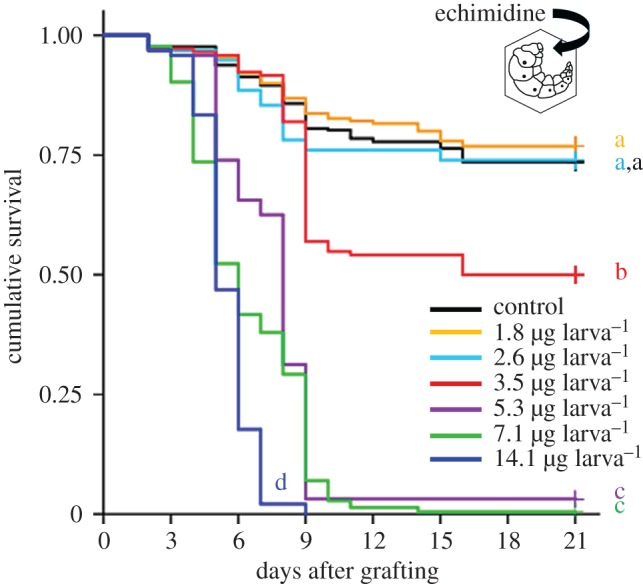
Toxicity of echimidine for larvae. Survival curves represent the control larvae (n = 288), larvae fed with echimidine at concentrations of 1.8 µg larva−1 (n = 190), 2.6 µg larva−1 (n = 96), 3.5 µg larva−1 (n = 144), 5.3 µg larva−1 (n = 96), 7.1 µg larva−1 (n = 216), and 14.1 µg larva−1 (n = 96). Bioassays were terminated at day 21, after the bees emerged as adults. Letters at the end of the curves designate significant differences between the treatment groups (pairwise log-rank tests, Bonferroni corrected, α* = 0.0024). At least two independent test series were performed for each concentration. Survival curves show the median values.