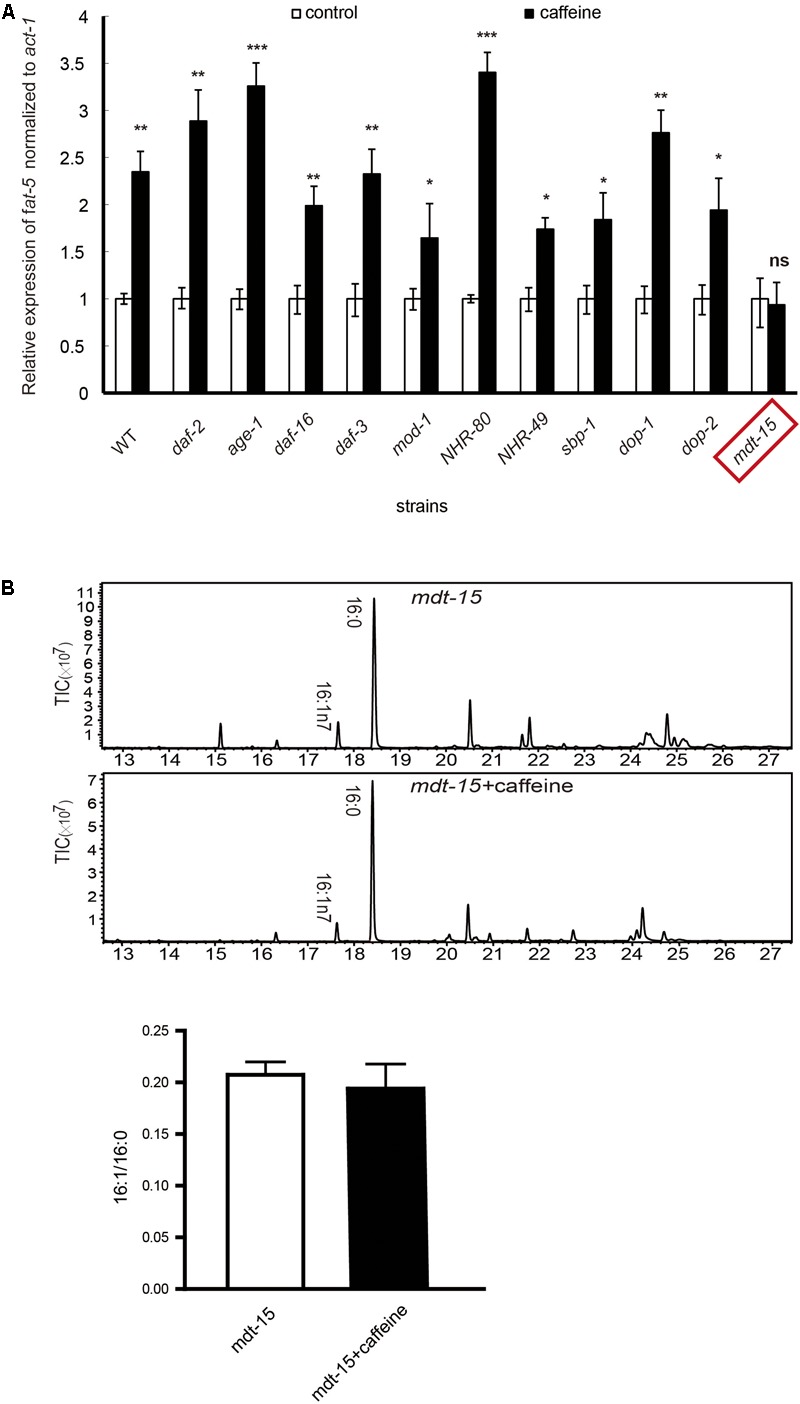
FIGURE 2.

mRNA expression and fatty acid compositions of worms. (A) The extent of increased expression in wild-type was about 2.5-fold. In all other mutant strains, the extent ranged from 1.5- to 3.5-fold. fat-5 mRNA expression was not significantly increased in mdt-15 mutant worms. (B) Fatty acid content results by GC-MS analysis. All assays were repeated at least three times. (B) It was analyzed using Student’s t-test. The data are described as mean ± SEM; ∗p < 0.05; ∗∗p < 0.01; ∗∗∗p < 0.001.
