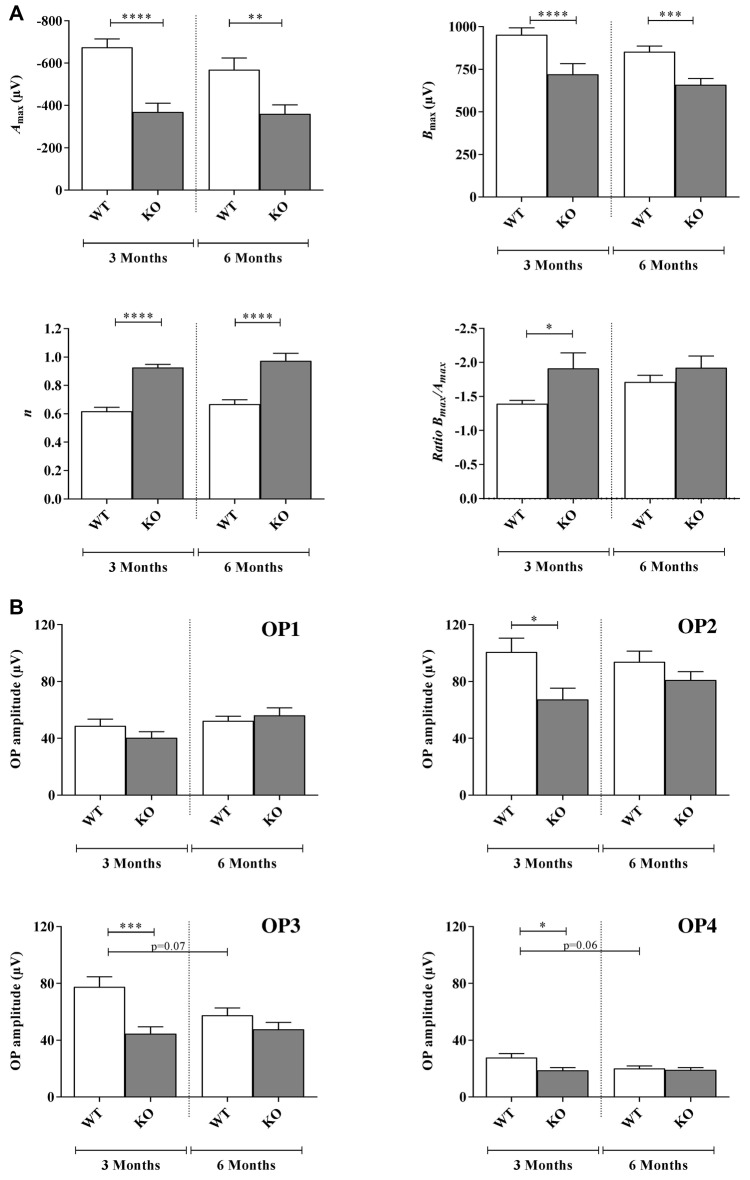
Figure 2.
Scotopic ERG parameters measured in WT and Fmr1−/y (KO) mice at 3 and 6 months old. (A) Retinal function was assessed by recording ERG (WT n = 10 and Fmr1−/y n = 10 for each age). For each typical ERG obtained at light intensity −2.88 log(cd.s.m−2), the decreasing part of the a-wave was fitted to calculate the extrapolated maximal a-wave amplitude (Amax). From the fitted b-wave sensitivity curve obtained by serial responses to increasing flash stimuli (−3.47 log(cd.s.m−2) to 0.6 log(cd.s.m−2)) we calculated the saturated b-wave amplitude (Bmax) and the n parameter (representing the b-wave sensitivity curves slope). Ratio Bmax/Amax was also calculated. (B) OPs result in the ascending part of the b-wave. OPs were recorded by using a band-pass between 30 Hz and 300 Hz. For each OPs, the amplitude from the baseline to the peak and the latency were calculated. Data are presented as Mean ± SEM. Significant differences between WT and Fmr1−/y for one age time are noted by *p < 0.05; **p < 0.01; ***p < 0.001; ****p < 0.0001.

