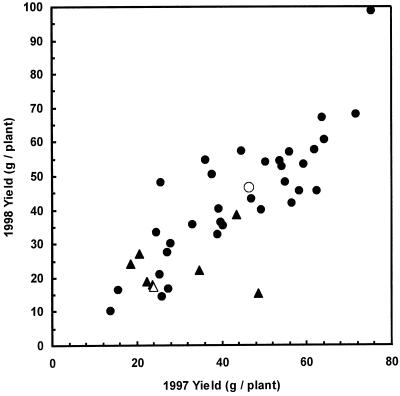
Figure 4.
Relationship between herbage dry matter production in 1997 and 1998 of control and independent transgenic alfalfa clones N4-4-2 and V4-11-3 containing pExSOD10. Control plants are shown as white symbols and transgenic plants as black symbols for clones N4-4-2 (circles) and V4-11-3 (triangles). The total herbage dry matter from three harvests was determined for each independent transgenic plant in the field trial at Elora Ontario. The positive relationship indicates that herbage production was consistent in the 2 years for individual transgenic plants. Plants that did not survive the winter were not included in the analysis and therefore these data are a measure of individual plant vigor. se = 10.3 (1997) and 10.9 (1998).

