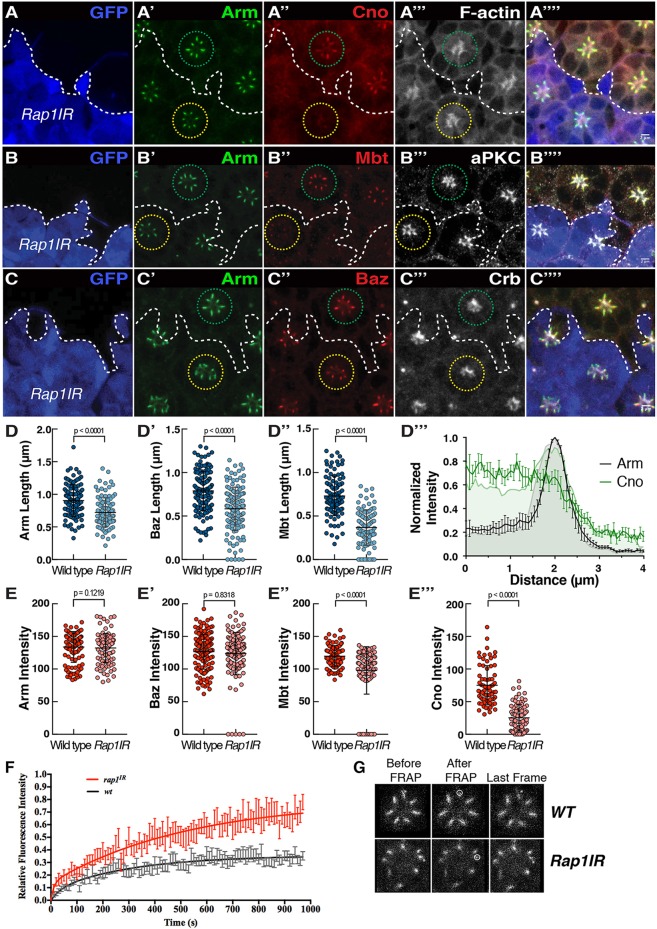
Fig. 2.
Rap1 regulates the accumulation of AJ material during ZA morphogenesis. (A–C) Rap1IR cells positively labeled for GFP (blue, the edge of which is denoted by the dashed line) and stained for Arm (A′,B′,C′), Cno (A″), Mbt (B″), Baz (C″), F-actin (A‴), aPKC (B‴) and Crb (C‴). Green circle, outline of wild-type ommatidia; yellow circle, outline of Rap1IR ommatidia. Scale bars: 2 μm. (D–D″) Quantification of Arm (D), Mbt (D′), Baz (D″) domain length at the ZA. Results are mean±s.d. (n≥105). (D‴) Normalized intensity profiles of Cno (green) and Arm (gray) in WT photoreceptors (shaded profiles) and Rap1IR photoreceptors. Results are mean±s.e.m. (n=7 cells from 3 retinas). (E–E‴) Quantification of Arm (E), Mbt (E′), Baz (E″) and Cno (E‴) mean pixel intensity at the ZA. Results are mean±s.d. (n≥105). (F) FRAP curve fit for E-Cad::GFP in wild-type (black) and Rap1IR (red) photoreceptors. For both genotypes, the basal end of the developing ZA (dashed circle) was photo-bleached (G). For wild-type ZA FRAP, n=14 and for Rap1IR, n=12. Error bars are s.e.m.

