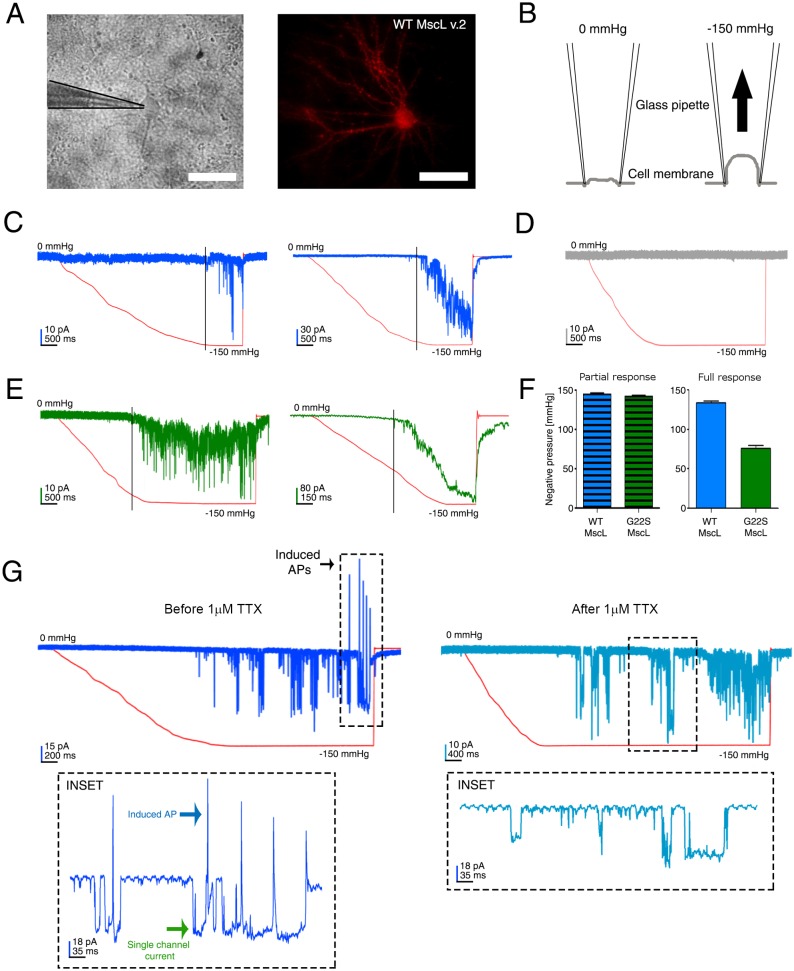
Fig. 3.
Electrophysiological characterization of the eMscL expressed in primary cortical neurons. (A) Bright-field (left) and fluorescence image (right) of a patched cortical neuron (15 DIV) expressing the eMscL construct. The red fluorescence signal is due to the tdTomato fluorescent protein encoded by the eMscL construct. Scale bars: 50 µm. (B) Cartoon indicating the procedure to perform pressure/voltage-clamp recording in cell-attached configuration during pressure-clamp stimulation. Application of a negative pressure induces the cell membrane stretch, which activates the gating of the eMscL. During the stimulation, a command potential of +30 mV was applied and, assuming a resting potential of −70 mV, the estimated applied potential was −100 mV. (C) Traces of the recorded ion currents (blue trace) during pressure stimulation (red trace) of the membrane patch, in a neuron expressing the WT eMscL. On the left, the trace reports a typical example of recorded ionic currents during a partial response. On the right, the current trace of an example of recorded full response. (D) Example of recorded ion current (gray trace) during pressure/voltage-clamp recording of a control neuron expressing only the tdTomato fluorescent protein. (E) Recorded ion currents (green trace) during the pressure stimulation of a neuron expressing the G22S eMscL. On the left, the trace reports a typical example of recorded partial response. On the right, the trace is a representative recording of a full response. (F) Bar graphs show the quantification of the pressure activation threshold required to trigger the WT-induced and G22S eMscL-induced currents. (Left) Quantification of the pressure threshold gating the partial response (145±0.98 mm Hg, n=72 stimulation trials, on n=19 cells, and 142.50±0.91 mm Hg, n=111 stimulation trials, on n=24 cells, for WT and G22S channels, respectively). (Right) Quantification of the pressure threshold histogram gating the full response (130±2.36, n=48, on n=10 cells, and 75.78±3.60, n=67 stimulation trials, on n=17 cells, for WT and G22S channels, respectively). Values are reported as mean±s.e.m. (G) Example of a recorded ion current trace on a cortical neuron (18 DIV) expressing the G22S channel. The traces correspond to the recorded ion currents on the same neuron before (left) and after (right) incubation with 1 µM TTX (dark blue and light blue traces, respectively). Red curves indicate the application of a negative pressure ramp. The enlarged insets illustrate a detail of the recoded traces in their respective upper panels. (Left) The recorded single-eMscL current (green arrow) and the associated generation of a neuronal action potential (blue arrow) before incubation with TTX. (Right) The sole presence of the eMscL single-channel ion current. Area surrounded by dashed line indicates channel currents with amplitude <50 pA that were associated with the generation of action potentials in both WT and G22S eMscL-expressing neurons.

