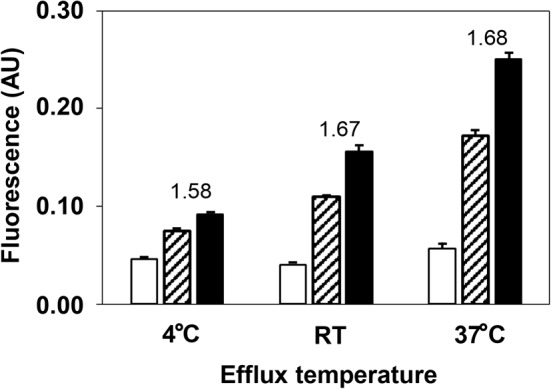
Figure 2. Effect of efflux temperature on CEC.

Two serum samples with lower CEC (hatched bar) and higher CEC (closed bar) and Buffer A (open bar) were treated with PEG to prepare the BDS samples. The CECs of these samples were determined at 4°C, RT, and 37°C. The number in the figure represents the CEC ratio (after subtracting base fluorescence) of higher CEC to lower CEC in each sample. All values are reported as the mean + SD (n=3); AU, arbitrary unit.
