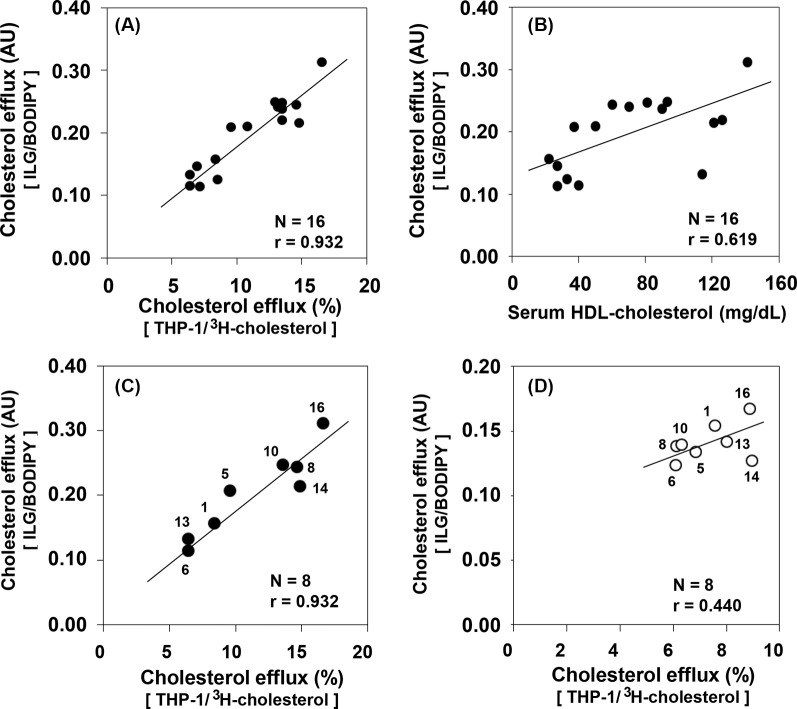
Figure 5. Correlations of CECs between the ILG/BODIPY and THP-1/3H-cholesterol methods.
The CECs of 16 serum samples with varying HDL-C concentrations (22–141 mg/dl) were determined by both the present method (ILG/BODIPY) and a commonly utilized method using foam cells derived from THP-1 cells with 3H-cholesterol as the tracer (THP-1/3H-cholesterol). Correlation of CECs between both methods was estimated in all samples (A). Correlation with CECs obtained by ILG/BODIPY methods and HDL-C was also estimated (B). HDLs were isolated by ultracentrifugation for 8 of the 16 samples described above. The data highlighting the correlation between the CEC values obtained with the ILG/BODIPY and THP-1/3H-cholesterol methods using BDS as the cholesterol acceptor for 8 samples were transferred from (A) (C). The correlation of the CECs using HDL as the cholesterol acceptor between the ILG/BODIPY method (40 μg protein/ml HDL) and THP-1/3H-cholesterol method (20 μg protein/ml HDL) was estimated (D). The numbers in (C) and (D) correspond to the sample numbers indicated in Table 2; AU, arbitrary unit.

