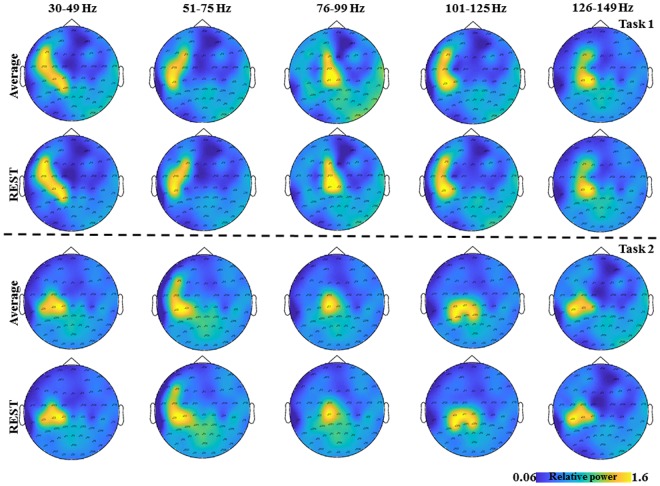
FIGURE 2.
The topological plots of the grand average GS from all the subjects for the five frequency bands separately (30–49, 51–75, 76–99, 101–125, and 126–149 Hz) and time interval (0–2.5 s) are depicted. The first row shows the topological plots of the Task 1 for common average reference and the second row shows the plots for the zero reference scheme. The third row shows the topological plots of the Task 2 for common average reference and the fourth row shows the plots for the zero reference scheme. The color bar represents the relative power in the interval 0–2.5 s.

