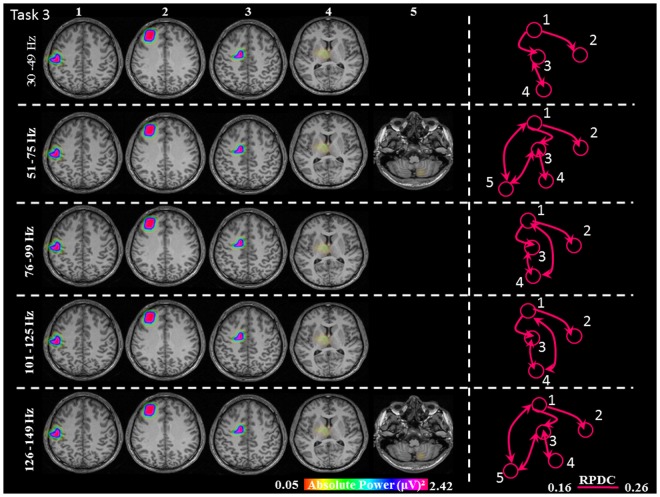
FIGURE 6.
Absolute gamma activity during the continuous Task 3. Estimated sources and direction of information flow in the five frequency bands. The individual maps of power were spatially normalized and interpolated on standard T1-weighted MRI scans with 1 mm spacing in MNI space. The color bar represents the relative power. 1: primary sensorimotor cortex (S1M1); 2: dorsolateral prefrontal cortex (dPFC); 3: supplementary motor area (SMA); 4/5: thalamus (TH)/cerebellum (CER); RPDC, renormalized partial directed coherence.

