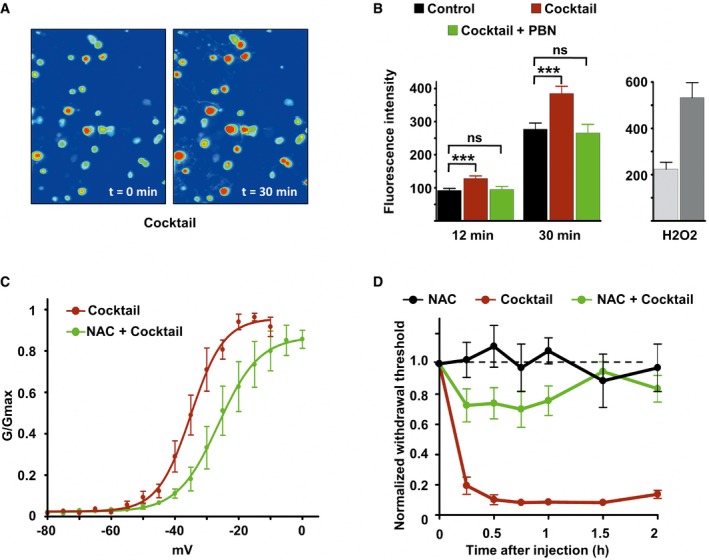
Imaging of DRG neurons loaded with the ROS‐sensitive probe H2DCFDA before (t = 0) and 30 min after inflammatory cocktail application.
Left panel: Fluorescence intensity of cultured DRG neurons loaded with ROS‐sensitive probe H2DCFDA in control neurons (black bars, n = 114), neurons treated with the inflammatory cocktail (red bars, n = 119), and neurons co‐treated with inflammatory cocktail and 4 mM of the ROS scavenger alpha‐phenyl‐N‐tert‐butyl nitrone (PBN, green bars, n = 95). Measure of fluorescence intensity was made 12 and 30 min after drug application. Right panel: positive control for ROS detection. DRG neurons (n = 15) were treated with 0.3% H2O2 and imaged at 12 (light gray) and 30 min (dark gray) after drug application. Fluorescence intensity (B) was analyzed with a non‐parametric Mann‐Whitney U‐test. ***P < 0.001.
Activation curves of Nav1.9 current fitted with single Boltzmann equations giving V
0.5 values of −35.02 ± 0.79 mV (n = 3, black line) and −26.34 ± 1.5 mV (n = 8, green line) for cells treated with the cocktail or with cocktail + NAC, respectively. Current were recorded 10 min after adding drugs.
Comparison of mechanical hypersensitivity induced by intraplantar injection of NAC (n = 5, 20 mM), cocktail (20×, n = 4), and NAC + cocktail (n = 9). Note that the effects of cocktail were strongly reduced by NAC when injected simultaneously.
Data information: All values are shown as mean ± standard error of the mean (SEM).

