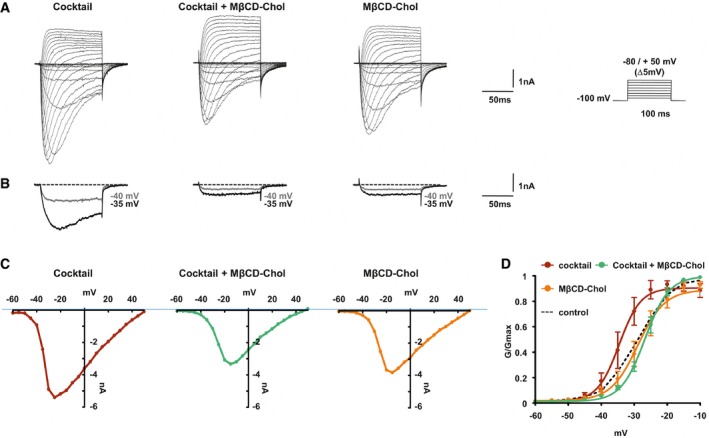
Figure 7. Cholesterol delivery prevents the modulation of Nav1.9 currents by inflammatory mediators.

- Representative current traces evoked by 100‐ms depolarizing voltage steps ranged from −80 to +50 mV (Δ 5 mV, Vh = −100 mV) of DRG neurons treated with inflammatory cocktail, inflammatory cocktail plus MβCD‐chol, or MβCD‐chol alone. DRG neurons were pre‐incubated for 15 min at 37°C with DMEM alone or supplemented with 20 mM of MβCD‐chol; when used, the inflammatory cocktail was added to extracellular solution at room temperature (RT).
- Nav1.9 currents evoked at −40 and −35 mV (gray and black traces, respectively) extracted for clarity's sake from (A).
- Corresponding current–voltage relationships of Nav1.9 currents treated with an inflammatory cocktail, inflammatory cocktail plus MβCD‐chol, or MβCD‐chol alone.
- Mean activation curves of Nav1.9 currents recorded in the different conditions fitted with single Boltzmann equations. Values for V 0.5 of activation are −27.3 ± 0.2 mV in control conditions (n = 5, black dashed line, same as Fig 4B), −28.9 ± 1.6 mV for MβCD‐chol (n = 8, orange line), −34.5 ± 2 mV for inflammatory cocktail (n = 7, red line), and −26.7 ± 0.7 mV for MβCD‐chol + inflammatory cocktail (n = 11, green line). Values are shown as mean ± standard error of the mean (SEM).
