
Figure EV1. Structural analysis & size‐exclusion chromatography of the Aurora‐A/TACC3 complex.
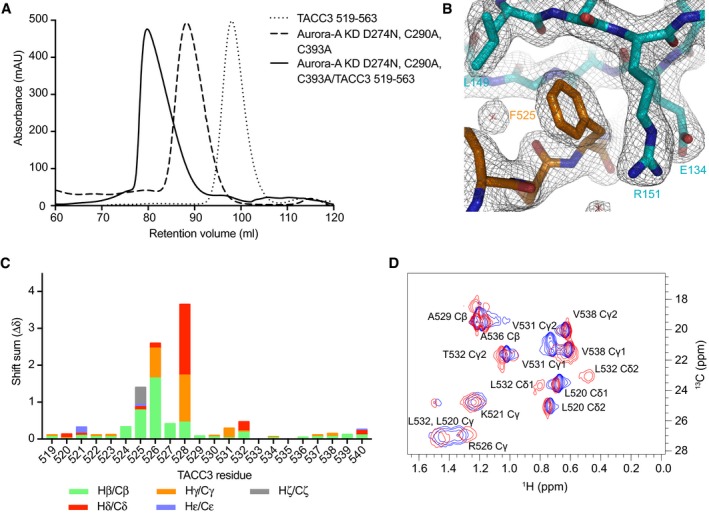
- Size‐exclusion chromatographs of Aurora‐A and TACC3 alone and in complex on a Superdex 200 16/600 column (GE Healthcare).
- Electron density map of the Aurora‐A/TACC3 complex. Aurora‐A is coloured cyan. TACC3 is coloured orange. The 2mFo‐DFc electron density map is shown as a wire mesh contoured at 1.0 σ.
- Side chain HC chemical shift perturbations observed for 13C15N TACC3 519–540 on the addition of Aurora‐AKD D274N.
- Small section showing mainly methyl group resonances from a 13C‐HSQC spectrum of TACC3 519–540. The spectrum for TACC3 519–540 is shown in blue. The spectrum collected on the addition of Aurora‐AKD D274N is coloured red.