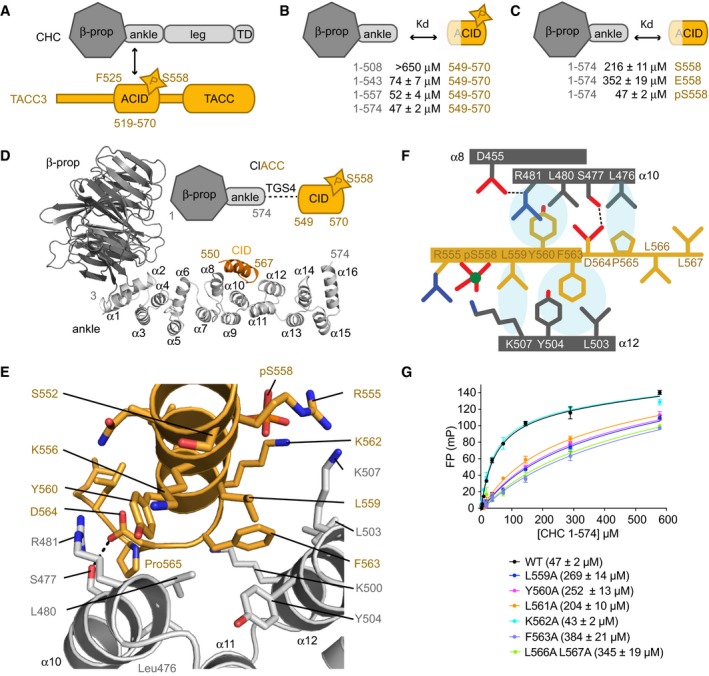
Figure 5. Crystal structure of ClACCp.

- Schematic illustration of CHC (grey) and TACC3 (orange) domain structures.
- Summary of the binding data between CHC proteins and TACC3CID peptides. See also panel (G) and Fig EV5A and B.
- FP assays to measure the binding affinity of CHC 1–574 to FAM‐labelled TACC3CID phosphorylated (pS558), unphosphorylated (S558) and phosphomimetic (S558E) forms. See also Fig EV5C.
- Overview of the crystal structure of ClACCp. Note that the linker between CHC aa574 and TACC3 aa550 is disordered.
- Magnified view of the CHC/TACC3 interaction. The side chains of key interacting residues are shown as sticks.
- Schematic illustration of the CHC/TACC3 interface.
- FP binding curves of CHC 1–574 with FAM‐phospho‐TACC3CID bearing alanine point mutations. Affinities are in parentheses. Data represent mean of three experiments ± SD.
