FIGURE 3.

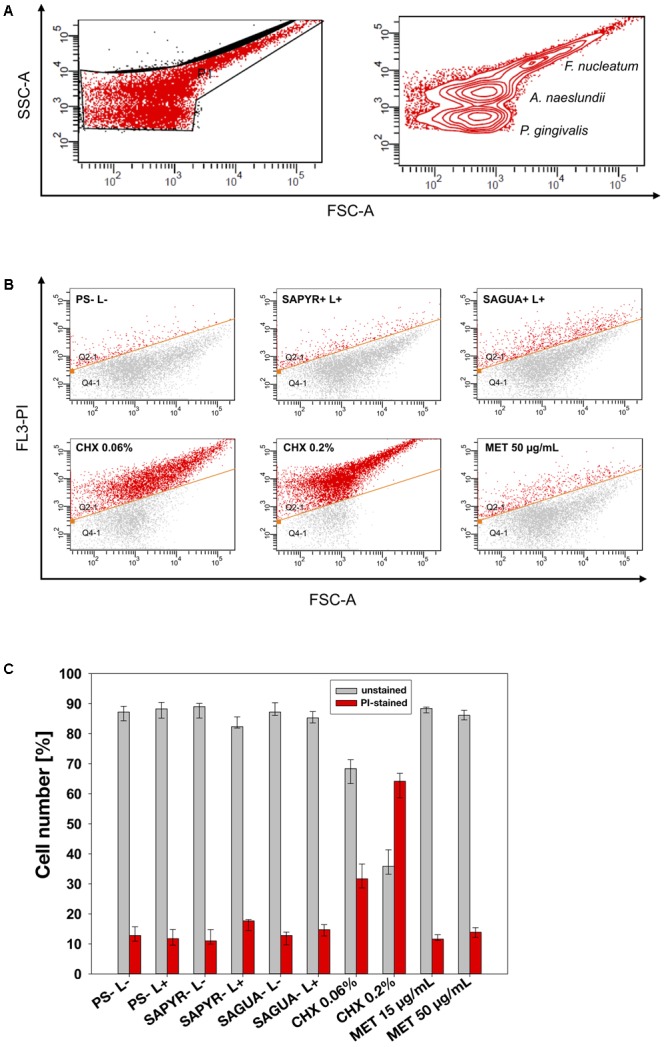
Flow cytometric analysis for cytoplasmic membrane damage. (A) Bacterial cell populations gated on dot plot FSC vs. SSC with P1 showing the chosen region of interest (ROI). Three populations could be discriminated (circles show high number of reads). (B) Exemplary dot plots for untreated controls (PS-L–) and groups treated with aPDT (SAPYR+L+; SAGUA+L+), CHX (CHX 0.06%; CHX 0.2%) or MET (MET 50 μg/mL), respectively. The gate below the orange line indicates unstained cells with intact membrane, while the gate above the orange line indicates PI-stained cells with damaged membrane. (C) Summarized median percentages, 1st and 3rd quartiles of unstained (gray) as well as PI-stained bacterial cells (red) are shown for all experimental groups. Membrane damage could only be observed after treatment with CHX in a concentration-dependent manner.
