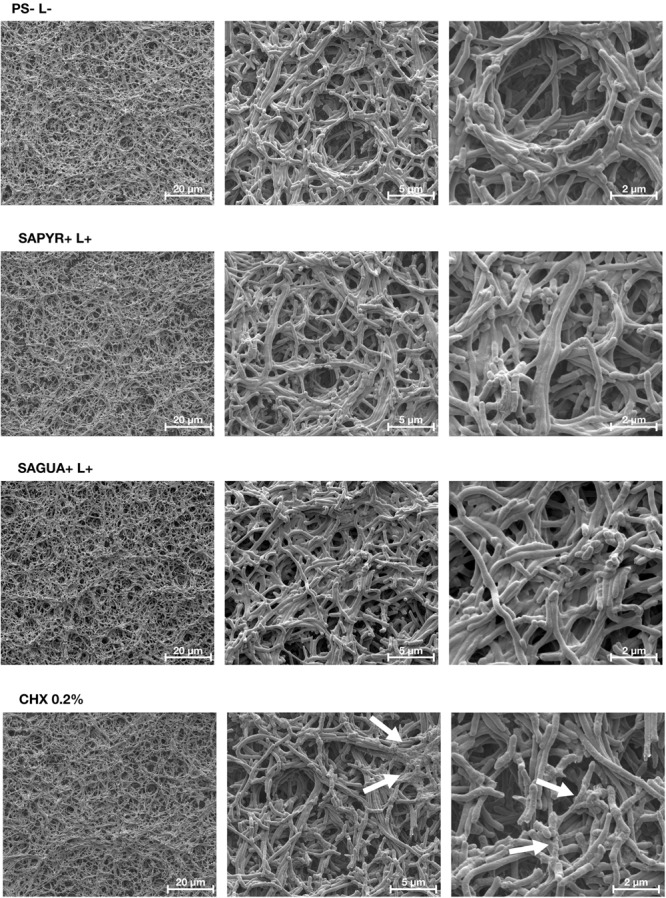
FIGURE 5.

Exemplary visualization of polymicrobial biofilms by means of scanning electron microscopy. Exemplary SEM visualization of randomly selected fields of untreated biofilms (PS-L–), biofilms treated with aPDT using SAPYR (SAPYR+L+) or SAGUA (SAGUA+L+) or treated with CHX (CHX 0.2%) in 3,000-fold, 12,000-fold, and 24,000-fold magnification. In the CHX-treated biofilms white arrows show debris most likely originating from killed cells on the top layer of the biofilms.
