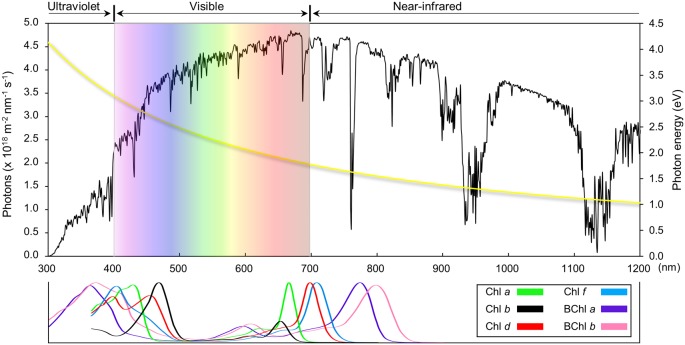
Figure 2. Solar spectrum and absorption profiles of chlorophyll and bacteriochlorophyll pigments.
The photon flux spectrum from 300 to 1200 nm of sunlight is plotted in black. Original data were obtained from the ‘Standard Tables for Reference Solar Spectral Irradiances: Direct Normal and Hemispherical on 37° Tilted Surface’ (https://www.astm.org/Standards/G173.htm). The UV, visible and near IR regions are indicated. Photon energy at each wavelength is plotted in yellow. Indicative absorption spectra of different chlorophyll and bacteriochlorophyll species in various solvents are normalized to the absorption maxima [22,75].

