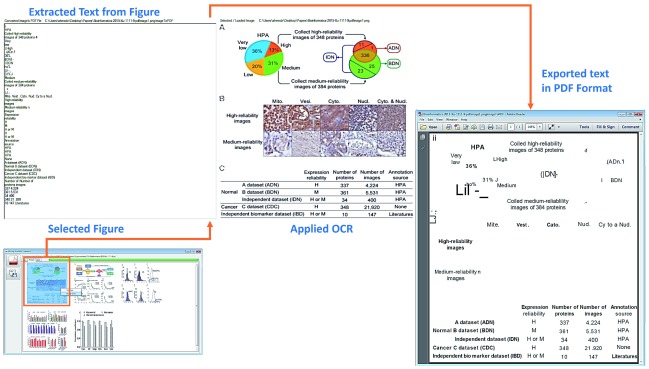
Figure 3. Example: Publication, Figure 1 of (YY et al., 2015).
This figure shows document image analysis, text extraction and PDF conversion. A figure (based on three panels; including two charts, one image and a table) is selected from one of the randomly selected papers 2 6. OCR (LEADTOOLS) is applied to extract and report the text from the figure in simple text form (section: Extracted Text from Figure) and in PDF file with similar margins to the original figure (section: Exported text in PDF format).

